SmartSpace Reporting
This document is a guide to the configuration and use of Ubisense SmartSpace Reporting. The intended audience includes users who are:
- Installing Reporting into a SmartSpace system
- Configuring Reporting for a SmartSpace system
- Users of configured reports, for whom the section Web reports at runtime is most relevant
Introduction to Reporting
In general terms, Reporting in SmartSpace is concerned with the long-term recording and analysis of data model state. The data model describes the current application state of the SmartSpace system, such as the set of objects currently being located, their current or recent state, and properties of those objects. See the documentation of Types and objects elsewhere. Reporting allows this state to be recorded into a database, and then for that database to be used to generate reports of the recorded state.
Reporting Architecture
The layers of the Reporting component are shown below.
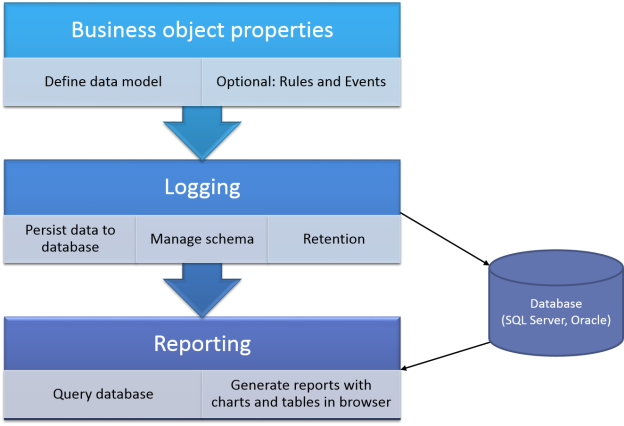
Business object properties
This layer permits the definition of the data model with user-defined types with a variety of simple and complex properties, as described in
Logging
In the Logging layer, the properties to be written to the database are chosen. As changes occur in the data model, they are saved into the database. The logging services automatically create database tables to match the chosen properties. They also manage the clean-up of old data according to the data retention settings for each property.
There are two different ways that a property can be logged: current values and temporal.
Current Values
For current values, when the value of a property changes for some object, only the most recent value is retained. For example, if the property is “name<Product>”, and the name of a given product is updated, the database will only record the current name of the product. The database row containing the previous name of the product will be updated to show the new name.
The database table also includes an integer column L_REMOVED. When a property is removed, it is marked as not being current in the database, but is still retained so that historical reports will still find the property value. For example, if a product instance is removed from SmartSpace, the “name<Product>” row for the object will have a flag “L_REMOVED” set to 1, but will not be removed from the database table.
A retention duration cannot be specified for properties logged with current values.
Temporal
Temporal logging records the history of changes to rows in the property. The database will indicate the date and time when each property row was inserted, and when it was removed. The database table includes two date/time columns, L_FROM and L_TO which indicate this time interval. The L_TO column is nullable, and will be null if the row is still currently present in the property.
For example, if the property is “<Process Area> contains <Product>: bool”, and a given product P1 enters process area Stage1 at date/time T1. The corresponding logged database table will now contain:
|
Process Area |
Product |
L_FROM |
L_TO |
|---|---|---|---|
|
Stage1 |
P1 |
T1 |
null |
Now P1 moves to process area Stage2 at date/time T2. The database table will now contain:
|
Process Area |
Product |
L_FROM |
L_TO |
|---|---|---|---|
|
Stage1 |
P1 |
T1 |
T2 |
|
Stage2 |
P1 |
T2 |
null |
A property that is logged temporally may also have a retention duration defined. The logging services automatically remove rows which have L_TO not-null and with a value older than the number of days defined in the retention setting.
A property that is logged temporally can also have a shift associated with it for use in recording duration. This is described in Recording duration using shifts.
Reporting
In the Reporting layer, reports are executed by querying the database, and the report results are displayed in the browser. If Reports engine developer is licensed, then reports can be created and edited in the browser-based editor as described in Designing Reports in SmartSpace. Without the developer license, only predefined reports can be loaded into SmartSpace and viewed by users. Reports are made available to specific user roles.
For information on viewing reports in SmartSpace Web, see Web reports at runtime.
Requirements
Database Engine
The reporting component requires a database engine in which the data will be recorded. In the current release, the following database engines are supported
SQL Server
Database versions: 2012 or higher.
-
Windows servers using ODBC and
-
Linux servers using Microsoft ODBC Driver 17 for SQL Server
Oracle
Database versions: 11G R2 or higher.
-
Windows servers using Oracle Instant Client 21.x library
-
Linux servers using Oracle Instant Client 21.x library
Note on computing containments at run-time (SQL Server only)
Under normal use, spatial containments are computed in real-time by the SmartSpace platform, and any containment properties required for reports are logged to the database. However, if reports are required to compute spatial containments directly from logged object locations at report run time, then the database engine must support spatial extensions. For SQL Server, this is available as standard.
SmartSpace does not provide similar support for computing containments at run time with Oracle.
Microsoft .NET Core
Like all SmartSpace components that provide web-based functionality, Reporting requires you to install Microsoft .NET Core.
See your installation guide for further information.
Installing Reporting Services
Reporting services support only one backend database at a time. So if SQL Server is the database required, only the reporting services for SQL Server should be installed and deployed, and the corresponding reporting services for Oracle must be undeployed and removed. Conversely, if Oracle is required, only its services should be available and the SQL Server services must not be present.
You can check which services are deployed using Service Manager.
Note: Use of SmartSpace Config to configure
-
Using Service Manager, open Ubisense > Reporting in the Services tree
-
Check that the following services are deployed (note they may be in a state of continually restarting until configuration is complete):
For SQL Server:
- Location logger SQLServer
- Property logger SQLServer
- Report client interface SQLServer
For Oracle:
- Location logger Oracle
- Property logger Oracle
- Report client interface Oracle
If these services are not visible in Service Manager, click Install services..., locate the installation files, and install and deploy them.
-
Ensure that the following services are not deployed. Undeploy and remove them if necessary:
For SQL Server:
- Location logger Oracle
- Property logger Oracle
- Report client interface Oracle
For Oracle:
- Location logger SQL Server
- Property logger SQL Server
- Report client interface SQL Server
Configuring Reporting
The first task when configuring reporting is to set up logging, so that data is written to the database and can be queried by reports. There are three stages to this:
- Create a database. The SmartSpace logging services must be able to connect to the database with sufficient privileges to make changes to the database schema, and to write and read data.
- Configure SmartSpace to connect to the database. The connection settings are stored in SmartSpace and can be tested.
- Configure logging of required properties. The mode of logging determines what happens in the database when the property values are changed, and how long they are retained.
Configuring the database connection and logging is carried out using the PROPERTY HISTORY task in SmartSpace Config.
Note: Use of SmartSpace Config to configure
Click on PROPERTY HISTORY to display the workspace.

The workspace is described in the following sections:
The current connection is displayed.
Select SQL Server or Oracle and click Edit to edit the connection string. Connection settings depend on how the database was created.
The middle pane shows a list of all defined properties. Double-click the property for which you want to record property rows and select a logging method and (temporal only) a retention interval.
Click Save and the database table corresponding to the logged property will be created automatically.
The bottom pane shows a list of all object types. Double-click the type for which you want to enable location logging and select a logging method and (temporal only) a retention interval. Set a distance threshold which is considered to be a “significant” change in location.
Click Save and the database table corresponding to the logged location will be created automatically.
Creating a Database with SQL Server
SQL Server on Windows
In general, the database must be created and configured such that the connection from SmartSpace has rights to modify the database schema, and to read and write data. The database engine documentation should be consulted for the details of how this is done. Here we walk through examples of setting up SQL Server database security both for a local database engine (running on the same server as the SmartSpace platform services) and for a remote database engine (running on a different server within the same domain).
SQL Server has two methods of authentication when connecting to the server: Windows Authentication and SQL Server.To see which are enabled for your server engine, Start SQL Server Management Studio and then connect to the database engine. Right click on the server at the top of the tree view, and select Properties.
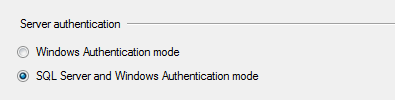
SQL Server authentication connections will not work unless SQL Server mode is enabled.
SQL Server on same server
For SQL Server on the same server as the SmartSpace controller, we will use integrated authentication. In SQL Server Management Studio:
- Create a new database
- Right-click on Databases in tree view and select ‘New Database…’
- Enter Database name
-
Add required roles
- Security -> Logins -> NT AUTHORITY\SYSTEM -> Properties
- User Mapping -> select database -> check db_datareader, db_datawriter, db_ddladmin
SQL Server on a remote server with SQL Server authentication
This method will require a username and password stored in the SmartSpace platform to connect to the server. In SQL Server Management Studio:
- Create a new database
- Right-click on Databases in tree view and select ‘New Database…’
- Enter Database name
- Add required roles
- Security -> Logins. Right click and select New Login
- Enter a login name, such as Ubisense, select SQL Server Authentication, and enter a password and policy options as required
- Select User Mapping under “select a page” on the left -> select database -> check db_datareader, db_datawriter, db_ddladmin
SQL Server on a remote server with integrated authentication
For SQL Server using integrated authentication and a domain-wide user, the services that connect to the database will all have to be running as the domain user you configure.
First create a service domain user for the Ubisense services. We will call this DOMAIN\UbisenseServiceUser. Then in SQL Server Management Studio:
- Create a new database
- Right-click on Databases in tree view and select ‘New Database…’
- Enter Database name
- Add required roles
- Security -> Logins -> DOMAIN\UbisenseServiceUser -> Properties
- User Mapping -> select database -> check db_datareader, db_datawriter, db_ddladmin.
- Now on the controller that will be running the reporting services run services.msc, and find the UbisenseServiceController 3 service. Double-click to edit properties, select the Logon tab, and enter the details for DOMAIN\UbisenseServiceUser.
- Ensure that the local dataset folder on this server allows full control for the DOMAIN\UbisenseServiceUser.
- Restart the controller service.
Connecting to SmartSpace with SQL Server on Windows
Connection settings depend on how the database was created above. To set and test connection settings, go to SmartSpace Config and select the PROPERTY HISTORY task. Select SQL Server from the dropdown and click Edit to set the connection string.

-
For integrated authentication methods enter a connection string in the form:
Driver={ODBC Driver 18 for SQL Server}; Server=localhost; Database=Ubisense; Trusted_Connection=Yes;If the server doesn’t have a trusted certificate, add (as a workaround): TrustServerCertificate=Yes;
Driver={ODBC Driver 18 for SQL Server}; Server=localhost; Database=Ubisense; Trusted_Connection=Yes; TrustServerCertificate=Yes;
-
For SQL Server authentication, enter a connection string in the form:
Driver={ODBC Driver 18 for SQL Server}; Server=localhost; Database=Ubisense; Uid=Ubisense; Pwd=mypassword;
Note: Make sure you ![]() escape any instances of the special characters “@” and “\” in your password.
escape any instances of the special characters “@” and “\” in your password.
Click Test to check that the login worked.
Troubleshooting connections to a remote SQL Server database
- The database instance needs to be correct. Try connecting using another tool, such as OSQL or sqlcmd first to make sure you have the right instance.
- Make sure the target SQL Server instance has firewall exceptions and has TCP/IP connections enabled.
-
If you want to use Windows authentication then the platform services (core and controller) need to be running as a domain user that is also valid on the SQL Server machine.
Otherwise you have to use SQL Server authentication and include the username/password in the connection string. See SQL Server on a remote server with SQL Server authentication.
- Make sure you are using the right version of the ODBC Driver for SQL Server in your connection string, and that version of ODBC Driver for SQL Server is available on your platform server.
Creating a Database with SQL Server on Linux
In general, the database must be created and configured such that the connection from SmartSpace has rights to modify the database schema, and to read and write data. The database engine documentation should be consulted for the details of how this is done.
For SQL Server on Linux, you must install the official ODBC client. Instructions are available on the Microsoft website: Microsoft ODBC Driver 17 for SQL Server
Ensure the driver in odbc.ini matches the string in odbcinst.ini.
cat /etc/odbcinst.ini

[ODBC Driver 17 for SQL Server]
Description=Microsoft ODBC Driver 17 for SQL Server
Driver=/opt/microsoft/msodbcsql17/lib64/libmsodbcsql-17.4.so.2.1
UsageCount=1
cat /etc/odbc.ini

[MSSQLServerDatabase]
Driver=ODBC Driver 17 for SQL Server
Description=Connect to my SQL Server instance
Trace=No
Server=sqlserverinstance.domain
Connecting to SmartSpace with SQL Server on Linux
To set and test connection settings, go to SmartSpace Config and select the PROPERTY HISTORY task. Select SQL Server from the dropdown and click Edit to set the connection string.
Enter a connection string like this: DSN=MSSQLServerDatabase;Database=RFID;UID=sqlserveruser;PWD=PASSWORD
Note: Make sure you ![]() escape any instances of the special characters “@” and “\” in your password.
escape any instances of the special characters “@” and “\” in your password.
Click Test to check that the login worked.
Note: the Microsoft ODBC driver can be configured to use Kerberos for authentication if this has been configured for your Linux server, thus avoiding the need to store credentials in SmartSpace Config. See the Microsoft documentation for details on how this can be set up.
Creating a Database with Oracle
The following outlines the steps required to establish a connection from SmartSpace to an Oracle database to support SmartSpace Reporting. The process starts with installing suitable Oracle client software on the Ubisense server and walks you through the steps to ensure that SmartSpace can connect to the database. Setting up an Oracle database is not described: it is assumed that a suitable schema and user account have been created in Oracle prior to configuring SmartSpace.
Required Database Privileges
The user account must have the following privileges in the Oracle schema:
- Create table
- Create procedure
- Create sequence
- Create type
- Select on DBA_OBJECTS
The user account must also have tablespace quota to permit the creation of database objects.
Installing the Oracle Client on Windows
This guide uses the example of installing a connection for Oracle 12.1. Other versions of Oracle will follow a similar procedure.
Oracle Client
The 32-bit version of Oracle Instant Client is required for compatibility with Ubisense services.
- Download the 32-bit Oracle Instant Client 21.x zipfile from https://www.oracle.com/technetwork/topics/winsoft-085727.html.
- Unzip the file, placing the contents in a suitable folder, for example C:\Oracle\instantclient_12_1.
-
Append this folder location to the system PATH environment variable.
Windows has two path variables, system and user: make sure you update the system environment variable.
- Start Control Panel and choose System and Security > System> Advanced system settings.
- Click Environment Variables....
- Select Path from the system variables in the lower pane, click Edit and amend the path by adding the location of the Oracle Instant Client.
Microsoft Visual C++ Redistributable
Oracle Instant Client 21.x requires that the redistributable package for Visual Studio 2010 is installed.
- Download the redistributable package for Visual Studio 2010 from Microsoft from https://support.microsoft.com/en-us/help/2977003/the-latest-supported-visual-c-downloads.
- Make sure to download the 32-bit version of this software: the downloaded file will be called vcredist_x86.exe.
- Run vcredist_x86.exe to install the redistributable library.
Disabling Automatic Diagnostic Repository
Recent Oracle database versions include the Automatic Diagnostic Repository (ADR) feature which is turned on by default when you deploy
Therefore ADR should be disabled on the machine that will be running the “Ubisense/Reporting/Report client interface Oracle” service.
-
Open the sqlnet.ora file.
This file is found in the TNS admin folder, which is usually pointed to by the environment variable TNS_ADMIN.
-
Append the following line to the file:
DIAG_ADR_ENABLED=off
Installing the Oracle Client on Linux
Requirements
To get Oracle reporting or RDBMS services to work, you must:
-
install libnsl using your preferred package manager
-
disable the Automatic Diagnostic Repository (ADR) feature included in recent versions of Oracle
Installation Process
Note: You need an Oracle account to download the Oracle client.
Download instantclient basic 12.2 x86-64 rpm from Oracle.
Ensure the prerequisites for instantclient are installed:
sudo apt-get install libaio1
For Debian-based systems, use alien to install the rpm:
sudo apt-get install alien
sudo alien -i oracle-instantclient12.2-basic-12.2.0.1.0-1.x86_64.rpm
Ensure that the dynamic linker can find the Oracle libraries by updating the runtime link path. For example, place the path to the instantclient libraries into a config file:
cat /etc/ld.so.conf.d/oracle.conf

/usr/lib/oracle/12.2/client64/lib/
Now update ldconfig:
sudo ldconfig
Disabling Automatic Diagnostic Repository
Recent Oracle database versions include the Automatic Diagnostic Repository (ADR) feature which is turned on by default when you deploy
Therefore ADR should be disabled on the machine that will be running the “Ubisense/Reporting/Report client interface Oracle” service.
-
Open the sqlnet.ora file.
This file is found in the TNS admin folder, which is usually pointed to by the environment variable TNS_ADMIN.
-
Append the following line to the file:
DIAG_ADR_ENABLED=off
Connecting to SmartSpace with Oracle
To set and test connection settings, go to SmartSpace Config and select the PROPERTY HISTORY task. Select Oracle from the dropdown and click Edit to set the connection string.
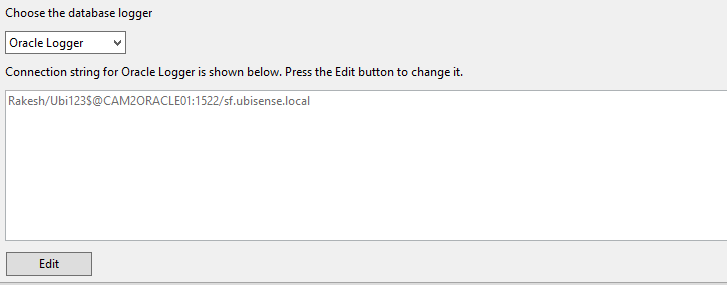
Enter the details of the user account and database that will be used to form the connection to the Oracle database. The connection string is in the typical Oracle OCI format:
For example:
Click Test to verify that a connection can be made. If this is successful, click Save to store the connection string. If this is a new database a number of tables and database objects will now be created in the database.
Use Service Manager to verify that the Reporting services are all stable and have ceased restarting.
Configuring Property and Location Logging
Property logging
With a database connected, you can now configure the logging required for each Business object property.
- Open SmartSpace Config and select the Property History task. The middle pane shows a list of all defined properties.

- Double-click the property for which you want to record property rows. Select a logging method: current values or a time interval (temporal).

-
If time interval is selected (temporal logging), you can configure two further options:
- a retention interval in days
- that the duration is recorded using shifts. See Recording duration using shifts for further information
- Click Save to apply the change. The database table corresponding to the logged property will be created automatically.
Selecting or deselecting The duration is recorded using shifts will also result in a schema change.
Location logging
If you want to generate location history reports, then you should enable location logging for the types of objects you wish to report on.
Open SmartSpace Config and select the Property History task. The bottom pane shows a list of all object types. Double-click the type for which you want locations logged, and enter the parameters:
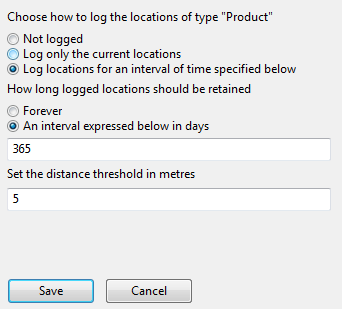
It is important to select a distance threshold that is as large as possible while still capturing the required level of detail. This reduces the amount of data that is stored into the database, and thus returned by location history queries. At the very least, the distance threshold should be greater than the noise expected from the location system, but generally you should set a threshold which is considered to be a “significant” change in location for the type of object tracked. Otherwise your database will quickly become unwieldy, and reports will be slow to generate and hard to interpret.
Recording duration using shifts
Recording duration using shifts can be specified when using temporal logging.
- Configure shifts in the Shift patterns workspace in SmartSpace Config or, if you have the Visibility component, in the Shifts screen in SmartSpace Web. See The Shift patterns workspace and Shifts in SmartSpace Web.
-
To enable the use of shifts for a business property, open SmartSpace Config and select the Property History task. The middle pane shows a list of all business properties. Double-click the type, select Log values for an interval of time specified below (temporal logging) and select The duration is recorded using shifts.
Selecting or deselecting this check box for a property will result in a Schema Change: see the section on Schema changes.
-
The shift to use for each logged object is configured using the Service parameters task in SmartSpace Config. Choose Shifts and then the type of object. (Use the Expand All button to display the object hierarchy, if necessary.) Drag the object into the object browser. Double-click a row and click Edit to define parameters: you can define parameters for a type or separately for individual objects (see The Service parameters workspace). Select the shift to use from the log duration in shift dropdown.

For each logged row, the shift associated with the first object in the row that has one defined will be used to log and compute shift duration. If no objects have a shift, then shift duration will not be computed and will stay at "0".
If the Reports engine developer is licensed, you can use the shift duration functions when writing queries. See Designing Reports in SmartSpace for further information.
Schema changes
If the configuration of logging for a property is changed such that the table columns in the database must be changed, the logging services will rename the current table, and create a new table with the required structure. It is up to the configurer to copy any previous rows that are still required, and provide any missing column values, by writing suitable SQL. The old table will be renamed by appending “_1”. If a table called “_1” already exists, that will be renamed to “_2”. If that table exists, it will be removed.
Indexes
Database indexes allow the database engine to execute queries and operations on tables without having to scan through the entire table contents.
Note that although the logging services create the schema tables with suitable formats to record the logged properties, they do not create any indexes on those tables. The reason for this is that the specific indexes best suited to the application depend on the data logged and on the queries that are executed against that logged data. Since each index created increases database storage use, and also adds overhead for row changes, no indexes are created by default.
It is suggested that an index should be created for each object column in the tables that are created, as these are the most commonly joined columns. However missing index analysis, or database performance optimization tools, might be used to find a better set of indexes to be generated. It is suggested that checks should be performed from time to time during production operation of the Reporting component, especially if executed queries are becoming slow, or database engine load is growing. For further details, see the third-party documentation:
- SQL Server Profiler
- Oracle SQL Tuning Advisor
Designing Reports in SmartSpace
This section describes how to configure or design reports in SmartSpace. Designing reports can only be done if the Reports engine developer feature has been licensed. Otherwise you can load and run third-party designed reports.
Before you can run or design reports, you must have configured your database, as described in Configuring Reporting.
Loading predefined reports
The Reporting component comes with command-line tools that can be used to import reports written by other parties. This is most commonly used where the Reports Builder has not been licensed. The tools are ubisense_ai_config and ubisense_report_config.
These command-line tools are deployed using the Ubisense Application Manager. Select the DOWNLOADABLES task, and select Reporting/Reporting admin tools. Click Download selected items and specify a path into which the tools will be written. This will typically be a folder that is on the user PATH, to make it easy to run the command-line tools.
You will most likely be provided with scripts to load the reports into your SmartSpace platform using these tools. Run the tools with no arguments to see usage help.
Enabling the report editor
With Reports engine developer, you can edit reports directly from within the SmartSpace web site. In order to run the editor, you must be logged in as a user that has the Ubisense.SmartSpace.Administrator role. See Users and roles.
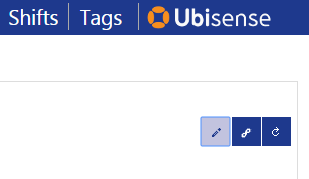
Once you are logged in as an administrator, visit the Reporting section of the SmartSpace web site, and you will see an edit button as part of the interface.
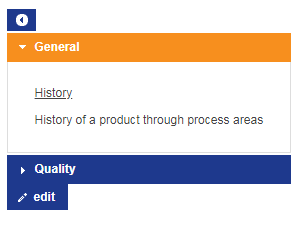
Click edit to open the main editor pane. You can also click the pencil button in the top right corner when viewing a specific report, to directly edit the definition of that report.
The report editor window
The report editor has five sections: Queries, Tables, Charts, Reports and Timezones.

Click on the header for a section to expand the contents. The structure of a report definition is as follows:
Reports
A report consists of a number of divisions, each of which is either a table or a chart, along with parameters and filters that control what subset of the data is displayed, and the roles for which the report is visible. See Defining Reports.
Charts
A chart displays report data in graphical form – line charts, histograms, flow charts, and location history. Depending on the type of chart various options can be set to control its appearance. See Defining Charts.
Tables
A table displays report data in tabular form, and provides options for formatting data, colors, sorting and paging. See Defining Tables.
Queries
A query specifies how data is extracted from the properties logged to the database. This is the heart of the reporting component, because it provides a powerful builder to generate arbitrary views joining together multiple logged properties of objects. Expressions can be computed, and results can be aggregated as required for the report. See Defining Queries.
Timezones
This section is used to set the timezone of the site. Date/time filters and parameters in reports always use this “site local” timezone, regardless of the local timezone of the browser.
The timezone must be set during initial setup of logging. It will not normally need to be configured again.
Defining Queries
We will start by describing queries and how they are edited, and then work back through the tables and charts, and finally to the reports.
If you are familiar with writing SQL queries, follow the steps below to see how to use SQL queries with SmartSpace Reporting.
What is a query
A query is a recipe for extracting information from the database. When a query is executed, it returns a table of rows, and each row has a number of columns. Each row returned is some fact about the data you are retrieving from the database. Here are some simple examples of rows:
- A tracked object was located in some process step over a time interval:
- Object Name, Process Step Name, Start Time, End Time
- The number of objects that have been through a process step:
- Process Step Name, Number of Objects
- An object was located at a position over some time interval:
- Object Name, Position, Start Time, End Time
The query defines how these rows are computed from the database properties. To define the query, we have to specify:
- the source properties we need to use to build the result rows;
- how the properties are linked together to build each result row;
- external or user-specified parameters that are used to determine which rows are returned or how they are computed;
- any filtering that must be applied to restrict the set of result rows that are returned;
- if necessary, how the rows should be grouped together in order to compute sums, maximums, minimums, etc.;
- and finally, how the columns of the result rows are computed.
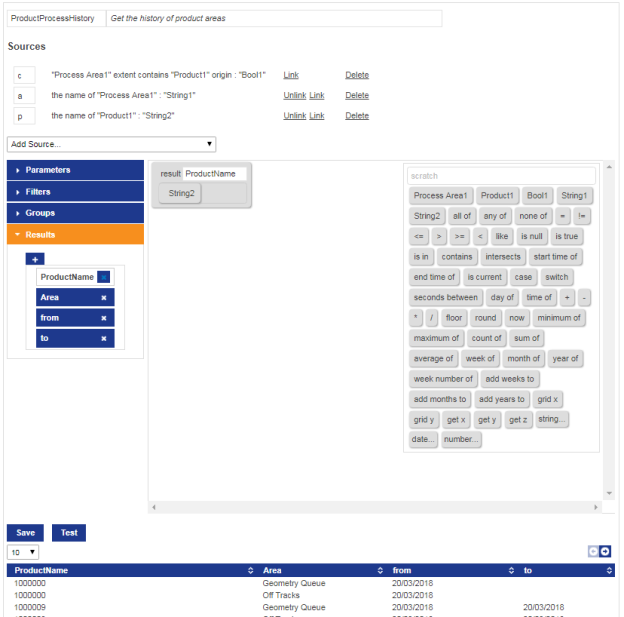
Query editor layout
These steps are presented as sections in the query editor. The sources and links are at the top of the editor. Parameters, filters, grouping and results are in the expandable sections below on the left. On the right is the drag-and-drop expression editor with its associated toolbox of terms and expressions. At the bottom of the page are the buttons to Save and Test the query, and the table showing test output. If the query has parameters defined for it, you can test the effects of these by typing into the fields alongside the test button.
You can test a query without saving it first.
The comment line next to the query name is not visible to end users, but is shown in the main report editor window next to the query name, so it is a good idea to describe the intended purpose of the query here.
Adding query sources
To add a source property to the query, select the property from the Add Source dropdown. Available sources will include all currently logged properties, and also any other queries already defined.
Once the property has been selected, it will appear as a new source line, and the property columns will appear in the toolbox to be added to expressions.
How multiple sources work
To understand the behavior of sources, a bit of background on relational database queries is necessary. Consider two database tables, as follows:
|
|
|||||||||||||||||
When we select ProductName and ProductModel, and return all columns as results, we would get the following table:
| Cross Join | |||
|---|---|---|---|
|
Product |
Name |
Product |
Model |
|
Object1 |
V000001 |
Object1 |
Alpha |
|
Object2 |
V000002 |
Object1 |
Alpha |
|
Object1 |
V000001 |
Object2 |
Beta |
|
Object2 |
V000002 |
Object2 |
Beta |
You can see that we have returned all possible combinations of rows from the two tables. Sometimes this is the actual result that is needed, but in this case we actually want the sensible set of results where the model and name refer to the same product object. To do this we conceptually filter the results by only returning rows where the first product column is equal to the second product column. We can then also remove the duplicate columns:
|
|
|||||||||||||||||||||||||||||||||||||
This join action is what you get in the query editor when you “link” columns together. Actually there is a subtle but important detail here, which is what happens when the second table does not have a value corresponding to the product in the first table:
|
|
|||||||||||||||||||
If we join these two, we are actually performing a “left join”, so all rows in the left table are in the results, regardless of whether the corresponding right hand table has a matching row. So we get:
| Left Join on Product | ||
|---|---|---|
|
Product |
Name |
Model |
|
Object1 |
V000001 |
Alpha |
|
Object2 |
V000002 |
Beta |
|
Object3 |
V000003 |
(null) |
That (null) result is a special value that indicates there was no corresponding data. When such a result is presented to the user, it gives a blank table entry, or a missing data point in a chart.
In the query editor, the sources are joined in the order they appear in the query sources. So when you link columns, you will get all rows from the first table joined with rows in the second. When you don’t link columns, you will get all pairs of rows in both tables. To get the behavior of an inner join (where only rows with a matching column in BOTH tables are returned) choose the two tables as sources without linking their columns, and then use a filter expression to filter for rows which have matching columns in the two sources.
Linking query sources
As described above, each column is considered as independent when the source is added to the query. The query will return all combinations of rows from each query source. To specify that columns in different sources are the same, click “Link” next to the source. You will be offered any of the unlinked columns from the source, and once you have selected one, you will be offered the choice of other compatible columns from other sources.
For example, here we add a source “Process Area” extent contains “Product” origin: “Bool”, and then also add the name of “Product”: “String”.
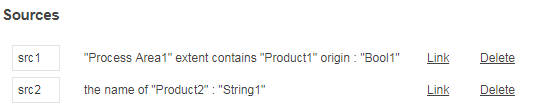
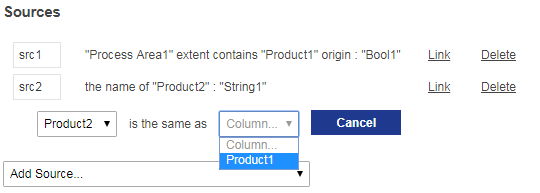
Here we have two Product columns in the query – Product1 and Product2. But we want these to be the same thing – so that String1 is the name of the product in the first source. So click on Link in the second source, and pick Product2:
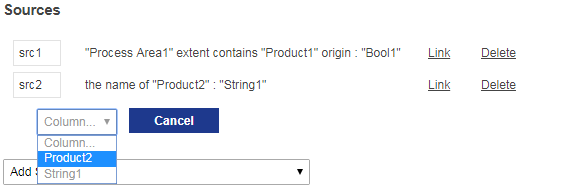
Then select Product1 from the second dropdown:
Now the sources look like this:
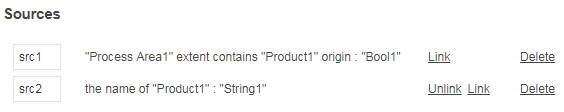
Note that there is only one Product object now, so String1 is the name of Product1.
Sub-queries
Note that it is possible, and indeed encouraged, to build a set of common queries and then use those as the basis for higher level queries. For example, if a product object has a name and a model, and several reports use product names and models, it would be sensible to create a single query that joins product, name and model, and to base the other reports on this query.
Result expressions
Continuing our example, we will now add some results and then test the query. To add a result, open the Results section of the editor, and then click on the “+” button to add a new result.
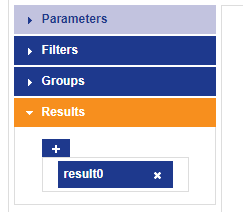
Select the new result, and a template for its expression will appear in the editor window.
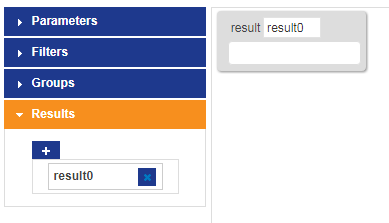
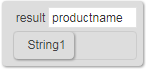
The name of the result column can be changed from result0 to something more meaningful, such as product.
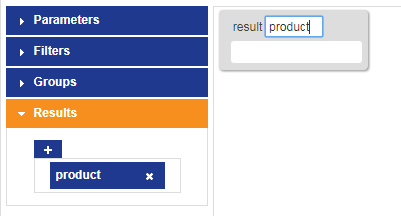
Now click in the blank space (slot) in the result template and the set of valid items for that slot will be highlighted in the toolbox:
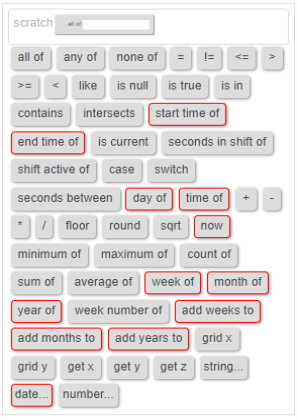
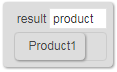
If you are unsure what you can put in a given slot in an expression, just click in the slot for help. Similarly, when you try to drag an item into a slot, the slot will be highlighted if the item can be dropped there.
In this case, we drag the Product1 to the result slot.
Now we add another result, select it, and drag String1 into it.We call it “productname”.
Now click Test to run this first query. The results should be shown in the test output:
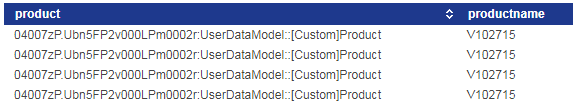
You can see the two result columns, one of which is the internal object identifier (not normally presented to the end user) and the other is the corresponding name of the product.
Filters
Filters allow the results of the query to be restricted to those for which an expression is satisfied. The expression is composed of predicates from the toolbox. See Toolbox elements for a description of all the available elements that can be used to build predicates.
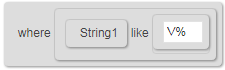
To build a filter, select the Filters section of the editor, and then click on “where” to show the filter expression. Drag predicates into the slot to build the filter expression required. For example, the following filter restricts results to those where the String1 column begins with a V.
Grouping
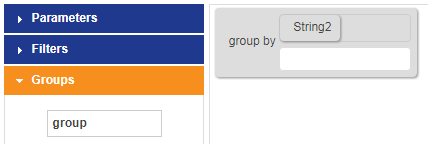
To define the groups over which to compute aggregation expressions, open the Groups section of the editor, and then click on “group” to show the grouping columns. Drag column values from the toolbox into the group slots. When an aggregation expression is used in a query the only things that can appear in the results are expressions based on the aggregation, or on the grouping columns. Other columns are being aggregated over, so are not defined in the results of the query. See Aggregation elements for details.
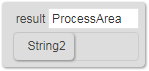
For example, if String2 is the name of a process area, you can aggregate results for each process area using the following group section.
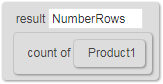
With this group section, the following example results would be allowed:
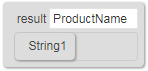
The following result would not be allowed:
If you find you need to group and aggregate over one set of columns, and then group again over another set, then split your query into a sub-query with the first group/aggregate, and then use that sub-query as a source in another query with the second group/aggregate.
Parameters
Parameters provide a way to restrict the results of a query based on user input when the report is run. To use parameters, you add the parameter name and type to the query definition. This makes the parameter available in the toolbox to be combined into the filter and result expressions. In this way you can specify exactly how each the parameter is used. Later, when you build a report containing charts/tables that are based on your query, you configure the parameter as a value that can be specified in the report. See also the section on Filters and parameters for how they are used in reports, and a simpler but less powerful alternative.
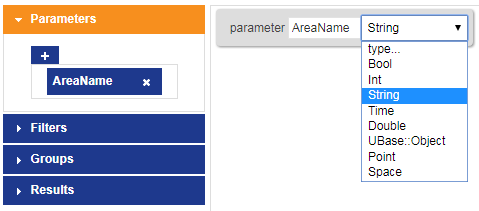
To add a parameter, click to open the Parameters section, and then click the “+” button to add a parameter. Select the new parameter to display it in the editor. You can change the parameter name, and select the type of parameter expected.
You can test the effects of parameters on a query, table or chart by typing into the fields alongside the test button and then clicking Test.

Roles
From version 3.5, the reports editor supports assigning roles that can execute queries directly to allow them to be run from an HMI. This is similar to ensuring that web searches bound in HMIs are available to the roles that can run the HMI. See SmartSpace HMIs for information on configuring HMIs and binding SmartSpace data sources.
The correct web site must be installed to match the services.
Note: A query can be executed as part of a Report without specifying roles here. You need only specify roles here if you are using the query with an HMI.
To add a role, click to open the Roles section, select a role from the dropdown and then click the “+” button to add it.

Toolbox elements
At the top of the toolbox is the Scratch area. You can drag an expression into the scratch area to copy into scratch, then drag it out of scratch to make a copy. You can use this, for example, to move expressions between different parts of the query.
To remove an expression you have dragged into the editor, just drag it back over the toolbox.
We will now describe the meaning of each of the elements in the toolbox. Many of these elements provide an expandable number of slots, where a new slot is added when the last one is filled. In these cases the last slot can be left empty.
all of
This provides an expandable number of slots, and is true if all the slots are true. It is a logical “AND” predicate.
any of
This also provides expandable slots, and is true if any one of the slots is true. It is a logical “OR” predicate.
none of
This returns true if none of its contents are true. It is a logical “NOR” predicate. If a single slot is used, this is a “NOT” predicate.
=
The equals operator returns true if the two slots have the same value. Note the subtle detail that null values are never considered equal in queries. This is because null means “has no value”, so you can’t say that it is equal to anything else. For this reason (null = null) will always be false.
!=
Returns true if the two values do not have the same value. Has the same treatment of nulls as the equals operator.
<=
Returns true if the first slot is less than or equal to the second. For strings this uses the collation settings of the database, which will typically reflect the locale by default.
>=
Returns true if the first slot is greater than or equal to the second. For strings this uses the collation settings of the database, which will typically reflect the locale by default.
<
Returns true if the first slot is strictly less than the second. For strings this uses the collation settings of the database, which will typically reflect the locale by default.
>
Returns true if the first slot is strictly greater than the second. For strings this uses the collation settings of the database, which will typically reflect the locale by default.
like
Returns true if the first slot matches the second slot pattern. There are two wildcards used in the pattern for the like operator:
| % | The percent sign represents zero, one, or multiple characters |
| _ | The underscore represents any single character |
The pattern must be in the second slot, but can be another expression that evaluates to a pattern.
is null
This test returns true if the slot has an undefined value.
is true
Another special operator, this turns a boolean value into a predicate that can appear in logical operators. For example, if a logged property includes a boolean column, use “is true” to allow that column value to be dropped into “any of”, “all of”, etc. This is necessary because of the distinction made in the underlying databases between boolean values (which are actually one bit numbers) and logical values.
is in
(RESERVED) This is not currently implemented, but will be used to bind to parameters with multiple values in a later release.
start time of
For source that is a temporal logged property, this function returns the date/time at which each row was created. It is invalid when applied to a source logged for current values, or a sub-query source.
end time of
For source that is a temporal logged property, this function returns the date/time at which each row was retracted, so it was no longer a current value of the business object properties. It is invalid when applied to a source logged for current values, or a sub-query source.
is current
For a property source, this is true for each row that is a current value in the corresponding property. This is typically used to remove historical logged rows from the results returned.
case
This is a multiple test expression element. It contains pairs of condition/expressions. The conditions are tested in order, and the expression is returned for the first condition that evaluates to true. If none are true, the default expression is returned.
switch
This is another multiple test expression element. It tests a single value expression against a set of pairs of test/result expressions. The result is returned for the first test expression that equals the value expression. If none of the test expressions equal the value expression, then the default is returned.
seconds between
This takes two date/time expressions, and computes the number of seconds between them. If “from” is later than “to” then the result will be negative. The computation is correct across clock changes such as daylight savings.
day of
This returns the date/time rounded to the start of the day in the local time zone.
time of
This gives the date/time in local time only, discarding the time zone offset in which the time was recorded.
+
Adds the slots. For strings, concatenates the slots.
-
Subtracts the slots.
*
Multiplies the slots.
/
Divides the first slot by the second slot.
floor
Returns the largest integer less than or equal to the slot.
round
Returns the nearest integer to the slot.
Returns the square root of a logged double property.
now
Returns the date/time at which the query is being evaluated.
week of
Returns the date/time at the start of the week that the slot is in. Start of the week is considered to be Monday.
month of
Returns the date/time of the start of the month that the slot is in. For example, 2015-02-15 01:59 will return 2015-02-01 00:00.
year of
Returns the date/time of the start of the year that the slot is in. For example, 2015-02-15 01:59 will return 2015-01-01 00:00.
week number of
Returns the ISO 8601 week number of the week the slot is in. For example, 2015-02-15 01:59 will return 7.
add weeks to
Returns the date/time which is a number of weeks after (or before for negative numbers) the given date/time.
add months to
Returns the date/time which is a number of months after (or before for negative numbers) the given date/time.
add years to
Returns the date/time which is a number of years after (or before for negative numbers) the given date/time.
grid x
Takes a point argument and a distance. Computes floor(point.x / d).
grid y
Takes a point argument and a distance. Computes floor(point.y / d).
get x
Returns the x coordinate of a point.
get y
Returns the y coordinate of a point.
get z
Returns the z coordinate of a point.
string…
Allows a literal string to be entered into query expressions.
date…
Allows a literal date to be entered into query expressions.
number…
Allows a literal floating point or integer number to be entered into query expressions.
seconds in shift of
Computes the duration of the row value up to the current time given the shift for that row. If used on a source that does not have "The duration is recorded using shifts" enabled, this will result in an invalid query.
shift active of
Returns true only if the shift for the row is currently active. If used on a source that does not have "The duration is recorded using shifts" enabled, this will result in an invalid query.
Aggregation elements
The following toolbox elements compute aggregate values over rows. When used without a “group by”, they compute the aggregate over all rows of the query, and only the aggregate can be in the results. When a “group by” is defined, the aggregation is computed for all rows with each distinct value of the group by columns, and those columns can also be included in the result expressions.
minimum of
Computes the minimum across all values.
maximum of
Computes the maximum across all values.
count of
Computes the count of all values.
sum of
Computes the sum of the values.
average of
Computes the average (mean) value.
Spatial elements (SQL Server only)
The following toolbox elements are spatial and should only be used if you have set up spatial indexes on the database. It is better, if you can, to compute spatial properties using the Business object properties feature, and then log those spatial properties, since these are symbolic and do not require on-the-fly spatial computations to execute the queries.
contains
True if the first slot contains the second slot. The first slot must be a space, and the second can be either a space or a point.
intersects
True if the first slot intersects the second slot. The first slot must be a space, and the second can be either a space or a point.
Saving
To save the changes to the query, click Save.
If you close the editor window without saving, or navigate away, then any changes will be lost. The editor will prompt to confirm this action.
SQL Queries
SmartSpace Reporting supports SQL queries from release 3.9. This allows you to write queries on the logged property schema using SQL, and to expose these queries for use in tables, charts, reports, and as subqueries.
In order to be used as a query, you must define the names and types of each column returned by a SQL query. You can also define a set of SmartSpace roles that are allowed to execute the query directly, for example from HMIs.
There are two ways to define and maintain SQL queries:
-
Within the query editor in the SmartSpace website
-
As SQL files which can be loaded into SmartSpace using a command-line tool
These methods are interoperable, so queries added using the query editor can then be managed using the command-line tool, and vice versa.
SQL queries act like any other query, so they can be used as sources for other queries built in the query editor. If a SQL query does not work as a source for other queries, it is likely that the joined column names do not correctly match the names of the columns in the query.
Query editor
Click Switch to SQL in the query builder to switch the view to the SQL query editor. The current query is replaced by a basic SQL query for editing. To leave the SQL editor, click Switch to query builder.

Changes are only written to SmartSpace when you click Save. If you switch away from the SQL query editor without saving, a warning displays. Either save the query or refresh the page to abandon unsaved changes.
The SQL query editor has a multi-line editor for the SQL queries, which has SQL syntax highlighting and panels to declare the name and type of each column returned by the query, and the roles it is exposed to. The names of the columns are required as SmartSpace needs them in order to use the query for tables and charts, and as a subquery. The types of the columns are also required because they define how the columns are treated as SmartSpace types. In particular, a query returning an object column can be declared as being of a specific type in the user data model. This determines how that column can be used and joined to other queries.

To test queries, click Test. A query will not run correctly unless the names of the result columns in SQL match those declared and the types are compatible. In the example above, if the type of "message" changed from String to Int, the test execution would fail with an error:
Could not execute query
Database error "Incompatible data types in stream operation" in command "SELECT..."
SQL files
SQL files can be loaded into SmartSpace using the command-line tool ubisense_report_config. The tool supports two modes: load and save. These modes import and export SQL files as queries.
The SQL file must be annotated with a structured block comment (/* ... */) above the SQL query. The comment contains a line for the query name, a line for each result and role, and an optional internal comment.
|
Comment format |
Definition |
|---|---|
|
Name: [name] |
The name of the query within SmartSpace |
| Result: [name] = [type] | Declared that the given column name has a given type in SmartSpace. Results lines must appear in the order that columns are returned by the query, and there must be one result declared for each column returned. |
| Role: [role] | Declares that the query can be directly executed by users with the given role. There can be multiple Role lines. |
| [Any other comment] | The first non-empty line, which is not one of the above, is used as the comment describing the query inside SmartSpace. This is shown in the list of queries in the editor and at the top of the query editor. |
The save mode in ubisense_report_config can be used to save a SQL query as an annotated .sql file.
Only the first block comment in the file is parsed for these structured comments. Subsequent comments are allowed, but are ignored.
Supported SQL content
The SQL query must be a pure SQL SELECT statement, suitable for embedding as a subquery in other SQL SELECT statements. T-SQL (for SQL Server) or PL/SQL (for Oracle) are not supported.
In order to count the number of rows returned by the query, the query compiler will wrap the statement inside a query that counts the number of returned rows. The query will also be wrapped in a subquery that orders the resulting rows in order to sort table results.
For example, an ORDER BY clause in the outer SELECT statement is not allowed as it is not valid in subqueries.
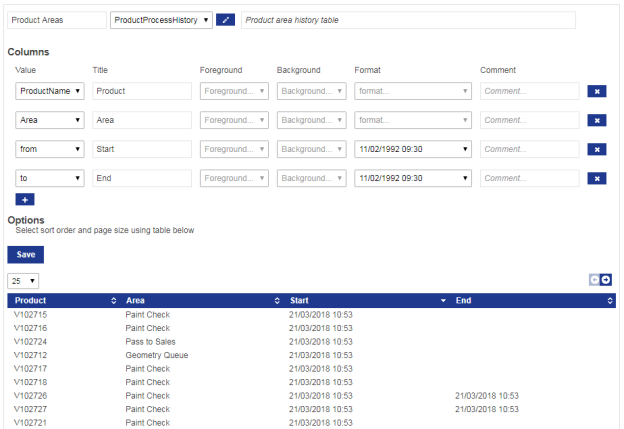
Defining Tables
To create a new table, open the Tables section of the report editor, enter the new table name and click Create. Then click the edit link next to the newly created table. This will open the table editor.
Source query
The first step in defining a table is to specify the query that will be used for its data. Select the query from the dropdown. As a short-cut, you can go to the query editor for the selected query by clicking the pencil button next to the query dropdown.
The comment field next to the source is not visible to end users who run the report, and can be used for internal reference and notes. It is shown in the top level report editor next to the name of the table.
Columns
Once the query has been selected, choose the columns to display in the table. Click the “+” button under Columns to add a column to the table. Select the query result to display as the column value, and optionally give it a title. If no title is given, the result name will appear as the column header. Note that as each change is made, the result view shows what the table might look like, running the query without any filter or parameter specified.
You can change the colors of the displayed table entries based on another query result. For example, if the query row should display a warning, add a query result column that returns a string that is a valid browser color based on the values in the row. Now select that result as either Foreground or Background columns. A color can be one of the following forms:
- A named color supported by all browsers. There are many web references for this list of colors, for example: https://www.w3schools.com/colors/colors_names.asp.
- A hex color, such as “#FF0000”, where the bytes are red, green, blue.
- A transparent color using the form “rgba(128,0,233,0.5)”. Here the first three parts are red, green and blue components in the range 0-255, and the last part is a floating point transparency (alpha) in the range 0-1, where 1 is a solid color, and 0 is completely transparent.
You can also specify a way to format columns such as numbers and date/times. Click the Format dropdown and choose how the column should be presented.
Again, a comment can also be added to each column, which will not be visible to the end user.
Sorting and paging
The sorting and paging options are configured by manipulating the test output table at the bottom of the editor.
To define the default sort order, click on a column header. Click again on a header to reverse the sort order for that column. To sort on additional columns, hold down Shift and click the relevant headings. You can add up to three columns to the sort order.
To define the default page size, click on the dropdown above the test output table, and select the number of rows to display per page by default.
Saving
Click the Save button to save any changes made to the table.
If you close the editor window without saving, or navigate away, then any changes will be lost. The editor will prompt to confirm this action.
Defining Charts
To create a new chart, open the Charts section of the report editor, enter the new chart name and click Create. Then click the edit link next to the newly created chart. This will open the chart editor.
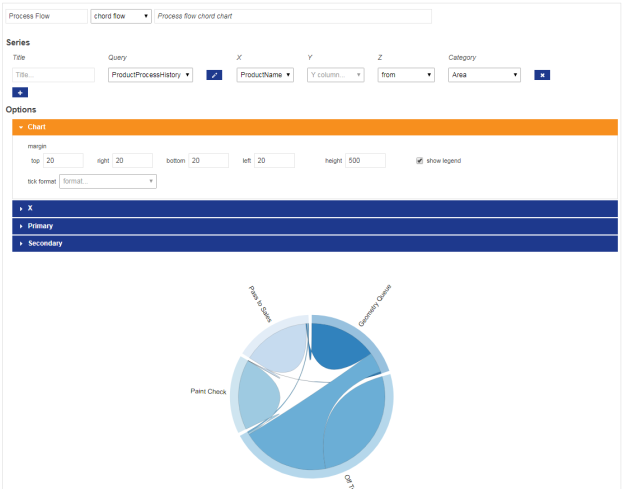
Chart type
The first thing to select is the type of chart. Click the dropdown next to the chart name, and pick the type of chart you wish to use.
The comment field next to the chart type is not visible to end users who run the report, and can be used for internal reference and notes. It is shown in the top level report editor next to the name of the chart.
The set of available chart types is described below, along with their properties and settings.
Series
Charts in general can have one or more series displayed. The series can either be from a single query where one of the columns is used as a category to split the results into separate series, or can be based on multiple different queries.
To add a series to the chart, click the “+” button under the Series section of the editor. Optionally give the series a name, and then select the query to use as source. You can go directly to the query editor for the selected query by clicking the pencil button.
Now select the query result columns to use as X, Y, Z and Category as required for the chart type. See their descriptions below for the meaning of these columns.
As soon as enough information has been configured, the editor will start drawing the chart as currently configured in the test panel at the bottom of the editor.
Common options
The following options are available to many of the types of chart:
- margin: the top, left, bottom and right margin to reserve around the chart, in pixel. This is the distance from the axes of the chart to the edges of the chart area, and includes the axis labels and tick marks.
- height: the height of the chart area in pixels.
- show x axis: whether to display or hide the x axis line, ticks and label.
- show y axis: whether to display or hide the y axis line, ticks and label.
- show legend: whether to show the category legend box and chooser.
- y axis on right: controls which side of the chart to draw the y axis.
- reduce x ticks: when checked, the chart does not show an X tick for every value. Commonly used with date/time axes. Uncheck this to ensure a tick mark exactly on each value.
- always show these X values: a list of X values, comma separated, to always display mark on the axis.
- always show these Y values: a list of Y values, space separated, that should always be included in the axis range, regardless of the data returned. For example “0 100”.
The following options are commonly to many chart X axes:
- label: the label to draw next to the x axis.
- tick format: how to format numbers for each tick mark.
- rotate labels by (degrees): how to angle to number next to each tick mark.
- ticks: the target number of ticks to display on the axis – this is a guide only as the charts will attempt to find a sensible round interval for the ticks.
- show max and min: when true display the values of the maximum and minimum on each axis.
- draw ticks at these values: a space separated list of tick values to show. A value may be skipped if too close to the min/max of the axis.
The following options are common to most chart Primary (Y) axes:
- label: the label to draw next to the x axis.
- tick format: how to format numbers for each tick mark.
- ticks: the target number of ticks to display on the axis – this is a guide only as the charts will attempt to find a sensible round interval for the ticks.
- show max and min: when true display the values of the maximum and minimum on each axis.
- draw ticks at these values: a space separated list of tick values to show. A value may be skipped if too close to the min/max of the axis.
Note that the Secondary options is a section reserved for future use.
Available chart types
The line chart plots a numeric Y coordinate against a number or date/time in X. The Z column is ignored. If Category column is selected, a separate line is drawn for each category value.
Extra options for the line chart include:
- fill zeros: when a line has a null value, replace it with a zero. Otherwise the line will break at that point.
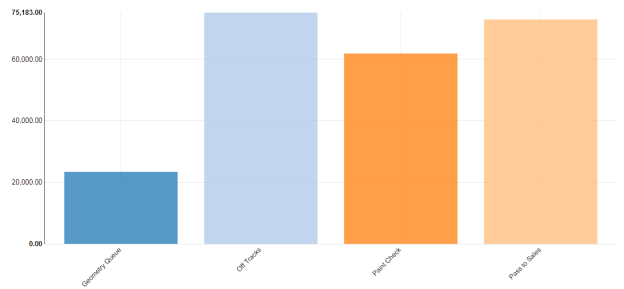
The discrete bar char plots a separate colored vertical bar for each value pair in the query results. The X can be a date, time, number or string. The Y will be a number. If the Category column is selected, then there will be a separate group of bars drawn for each value of the category in the results.
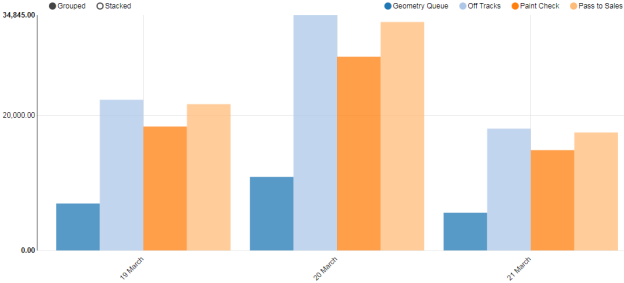
The multi bar chart supports grouped or stacked vertical bars by category.
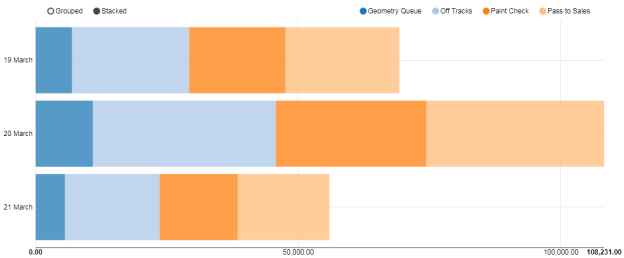
This is the same as the multi bar, but with the direction of the bars swapped to horizontal.
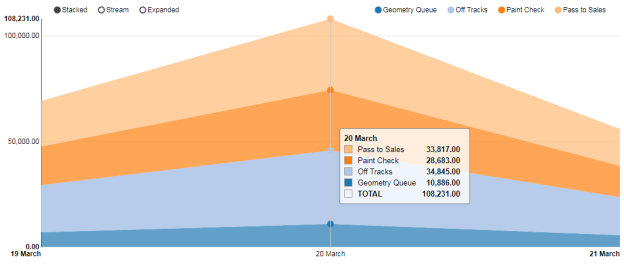
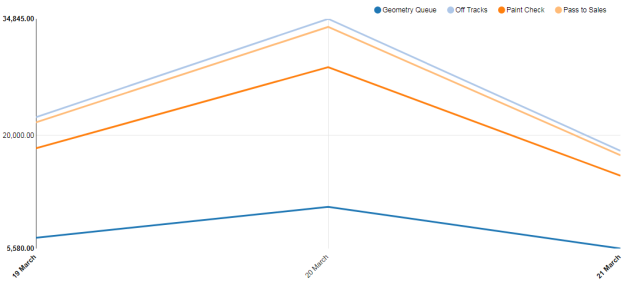
The area chart displays numerical data using the area underneath a chart. It allows stacking of data series, and can display the stacked values as a stream. Hover help shows values under the mouse location, or when tapping or clicking on the chart.
Extra options for the area chart include:
- show controls: displays or hides the stacked/stream/expanded control.
- style: the default style to use from stacked, stream or expanded, when the chart is initially drawn
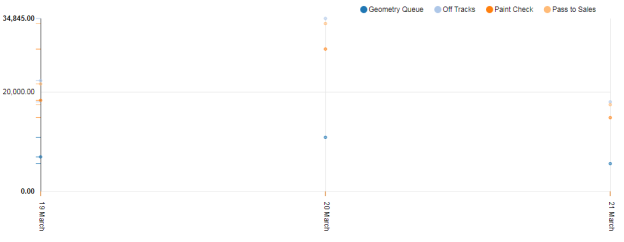
The scatter chart draws a simple disconnected point for each value of X, Y from the data source.
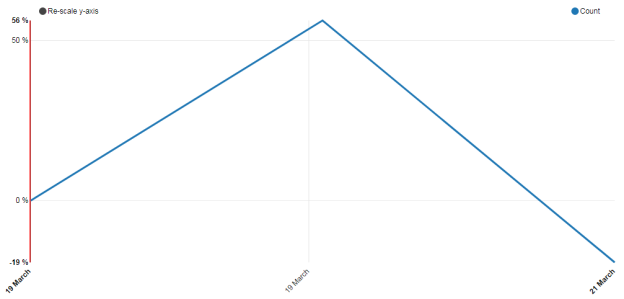
The cumulative chart shows the percentage change in Y values from their initial value over the range X.
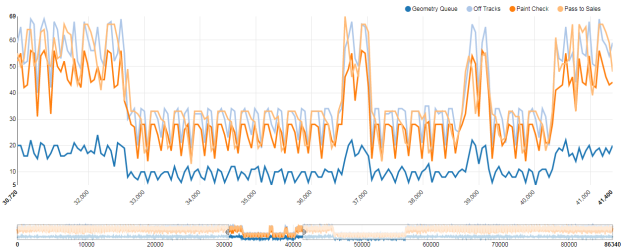
The line with focus is like the line chart, but designed for focusing in on specific ranges of the X axis. The chart is drawn with a range control underneath. Dragging on the range control selects the X range to show in the main chart.
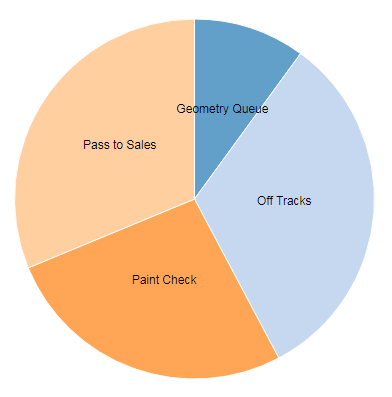
The pie chart shows a segmented view of values. It computes the sum of Y for each distinct value of X, and shows the relative sizes of these sums.
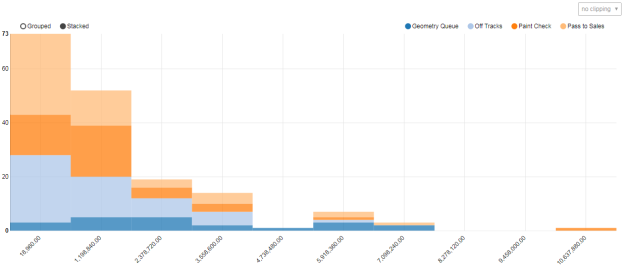
The histogram chart bins the values of Y against X, and shows the resulting distribution. The chart can include filtering to remove outliers. The Y column will be the range displayed along the horizontal axis, and the vertical axis will be the number of Y values within each bin across the returned rows from the query. The Category column is used to split the query results into groups, and a separate histogram is computed for each group. Duplicate values of the (X, Category) are summed together to produce a single Y value before the histogram is computed.
Extra options for the histogram chart include:
- histogram bins: select how the bin ranges are computed, either using
- a fixed bin size,
- a fixed number of bins,
- or a variable number of bins within a range, with a granularity parameter (1-10).
The granularity determines how the bins are rounded to lie on sensible numbers. The number is automatically scaled up or down by powers of ten so it is less than the query data range, and the bin size then rounded to the granularity.
- group spacing: the fraction of the size of the group to leave as a gap between groups (0-1).
- enable clipping control: display a control to set the method for clipping of outliers
- clipping: the default clipping range to use:
- none – don’t clip
- sigma N – clip to inside N * the standard deviation of the data from the mean of the data
- iqr N – clip to inside N * the interquartile range above or below the quartiles (25% and 75% percentiles)
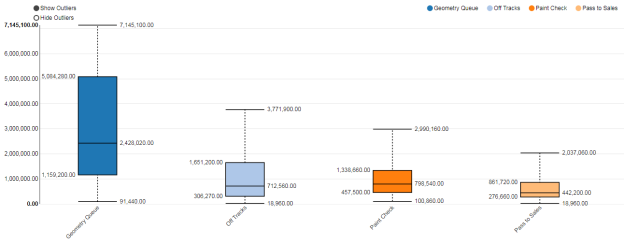
Another way to view distribution of data, the box plot shows the median, 25% and 75%, and then the outlier whiskers at median +- 1.5 times the interquartile range.
The extra box plot options are:
- show box labels: draw the values at each line
- show outlier points: draw values for each removed outlier
- show controls: allow the user to control whether to show outlier points
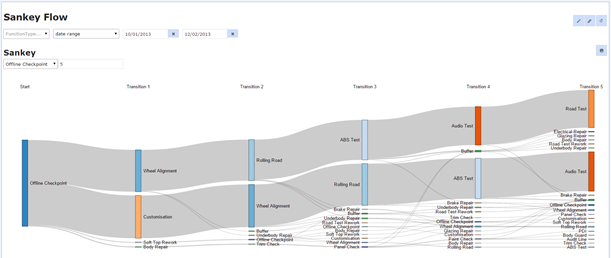
The Sankey flow chart shows the number of objects that went from one state to another, traced over some number of transitions in state. It provides a quick view of the movement of objects through process steps. The X column should identify a unique object, the Y column is a value than can be used to order the progress of the object, such as a time, and the Category column identifies the states, such as process steps.
Options for Sankey flow are:
- depth: how many transitions to show by default
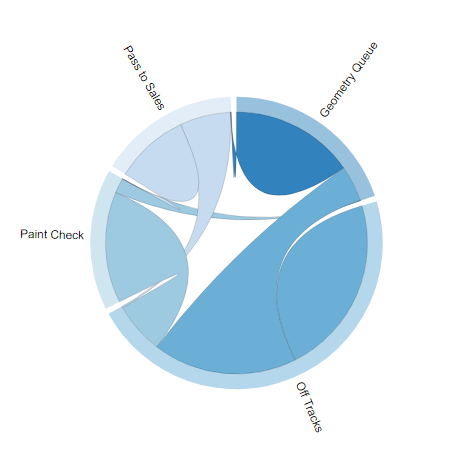
The chord flow chart also shows the number of objects making each possible state transition in the query data. As with the Sankey flow, the X column should identify a unique object, the Y column is a value than can be used to order the progress of the object, such as a time, and the Category column identifies the states, such as process steps.
In the chart, the states are shown as arcs around the edge of the circle. Each flow between pairs of states is shown as a curved area going between the two states, with the arc length of the flow at each end indicating the number of transitions in the data coming from the state to the other. Hover or click each flow to show the two states and the count of objects making that transition in either direction.

The location history chart displays the historical movements of objects against the background objects configured in the OBJECT PLACEMENT workspace.
The query used must have results called “from” and “to”, which are the start and end times for an object being at a given location. The case of these result fields is significant. Without these query result columns, the location history chart will not link points together, nor will it size points depending on how long the object was located at each point.
When defining the chart, select the name of each object as the "X" column, the points column as the "Y" column, and the "from" column as the "Z" column.
Optionally a grouping category can be selected as the "Category" column, in which case the resulting trails will be grouped by that category and a grouping key will also be displayed.
Smoothing
The chart supports smoothing of data. Currently a moving average filter is the only choice available. The parameter varies from 0.0 (no smoothing) to 1.0 (infinite smoothing). If the object location sequence is [p(1), p(2), p(3) ..., p(N)], and the parameter is beta, then the filter output sequence [q(1), q(2), q(3) ... q(N)] will be:
|
q(1) = p(1) q(i+1) = beta*q(i) + (1 - beta)*p(i+1) |
Hiding points
In order to make the chart usable with large numbers of returned points, the circles for each point are hidden when more than a given number of points are displayed. This threshold is defined in the parameter "hide points if more than". If this parameter is set too high, browsers may be very slow rendering the chart.
Pan and zoom
The report supports pan and zoom using the usual pinch/drag/mouse wheel methods. As the report is zoomed, the line widths are adjusted to show details, but the size of points is not.
The date range bar
The report includes a bar on the top right showing the range of dates in the data displayed. The start, end and middle of this bar can be dragged to filter the set of results shown. This can be used to "play back" the movement of objects, or to focus on a specific part of their history. If the date range includes fewer points than the "hide points if more than" parameter, points will be displayed.
Pop-up point data
When a point is clicked, a pop-up window will display information about it, including the object name, category, date/times and dwell time. Double-click a point to set it as a reference point. Once a reference point is selected, the pop-up window will also include time and distance information, including distance along the track if the reference point is for the same object.
Dwell time colors
The colors of the points can be determined by thresholds specified in the field called "dwell colors". You can use this field to define a list of thresholds, in hours, and colors for those thresholds. The colors need to be in a format that SVG accepts, such as the color name, hex codes, or RGBA. Each threshold is separated by a semicolon, and the threshold hour and color are separated by a colon. The point will use the color of the highest threshold that is satisfied by the dwell time of a point. If the dwell time of a point is less than the smallest threshold, then the default color is used. To change the default color, add a threshold of 0 and assign a color to it, for example "0:black".
In the following example, the highlighted point is orange as the point has stayed in one place for more than 30 minutes, but less than one hour. If the point does not move for one hour or more, but less than two hours, then the point will turn red.

Saving
Click Save to save any changes made to the chart.
If you close the editor window without saving, or navigate away, then any changes will be lost. The editor will prompt to confirm this action.
Defining Reports
To create a new report, open the Reports section of the report editor, enter the new report name and click Create. Then click the edit link next to the newly created report. This will open the report editor.

As described above, a report consists of a number of divisions, each of which is either a table or a chart, along with parameters and filters that control what subset of the data is displayed, and the roles for which the report is visible.
Options
Automatic refresh
Reports can be set to automatically refresh their data by entering a value into the refresh interval field. Reports can be expensive to generate if they include a lot of historical data, so automatic refresh should be used with caution, especially if the report includes charts that can return large data sets. For example, consider what will happen if the user sets a time filter of the report to “forever”.
Hide division headers
If hide division headers is checked, the headings of charts or tables included in the report are not displayed.
Hide in chooser
If you want a report to be unavailable for selection from the Reports link on the top menu bar of SmartSpace web, for example if it is only required for an HMI and should not be used otherwise, check hide in chooser.
Divisions
To add a table or chart to the report, click the “+” button underneath the Divisions section. Select the defined table or chart to add. If the “half width” button is checked, the division will be rendered at half the width of the page, allowing two divisions to appear side-by-side.
Filters and parameters
To add controls to the top of the report use the Controls section.
Parameters
Parameters, as discussed in the section Parameters above, are explicitly defined in each query. You can add a control for each parameter in a data source in the divisions of the report.
Click the “+” button under Parameters, and pick the parameter to add. You can give the parameter a name, and depending on the type of the parameter, a suitable set of controls will be added. You can also specify that the parameter should be a choice of values, where the candidates are returned by another query and column.
Filters
Filters offer less control, but are much easier to configure. To add a filter click the “+” button under the Filters section. Choose one of the columns in any of the queries used by any division in the report, and optionally give it a title. Controls will be added to the report based on the type of that column, and the value of that column will be constrained according to the controls. A default value can also be specified for filtered columns.
The type of control, and the filtering performed, depends on the selected column type.
- string: a text entry field is presented. Rows that contain the entered value as a substring will be returned.
- date/time: a dropdown of a set of predefined data ranges, and the option to pick a custom date range. The rows that have a date/time within the range selected will be returned.
- numeric: a pair of text entry fields are presented to define a numeric range. Rows that have values within the greater than the minimum entered number and less than the maximum entered number will be returned.
- boolean: a dropdown choice is presented. If the dropdown value is true or false, only rows with that value for the column will be returned. Otherwise all rows will be returned.
Roles
To make the report visible to a given role of user, click the “+” button under the Roles section, and then pick the role from the dropdown box. Until a report has been added to roles, it will not appear under the Reports section of the web site to anyone but the administrator. Note that the administrator role (Ubisense.SmartSpace.Administrator) can view any report, regardless of the roles configured.
Saving
Click Save to save any changes made to the report.
If you close the editor window without saving, or navigate away, then any changes will be lost. The editor will prompt to confirm this action.
You can also click Save and View to save changes and immediately go to the report.
Displaying location history with a user-specified time interval
This example shows how to configure the location history chart to display locations for a user-input time interval. This allows the selection of a time range with more precision than using the date range bar (described in Location history). There is no way to do this using the normal filters, so you need to use parameters instead, specifically by using a string parameter and relying on SQLServer to convert this automatically to a date/time when it executes the query.
If you create a report based on this example, you might want to save it as an extra report, for example called location history for specific dates and times, so that you can use it in addition to the standard location history chart.
To create your custom report:
- In your location query, define two parameters, “From” and “To”, both of type String:

- Now in filters, set the where clause to use these parameters to constrain the start time of the locations rows:

- Now add the parameters to the report definition, instead of a filter on the From time.

- You can now enter a date/time range in text format to get back a specific interval.

Web reports at runtime
To view configured reports, go to the web site, and click on the Reports link on the top menu bar. If this link is not shown, you are not logged in as a user with access to any reports. Make sure you click Login.
The set of reports available to your user roles will be displayed.
The reports are grouped by the role for which they are intended. To view reports in a role, click the title of the role.
To view a report, click the report link. Controls at the top of each report can be used to restrict the set of results returned.
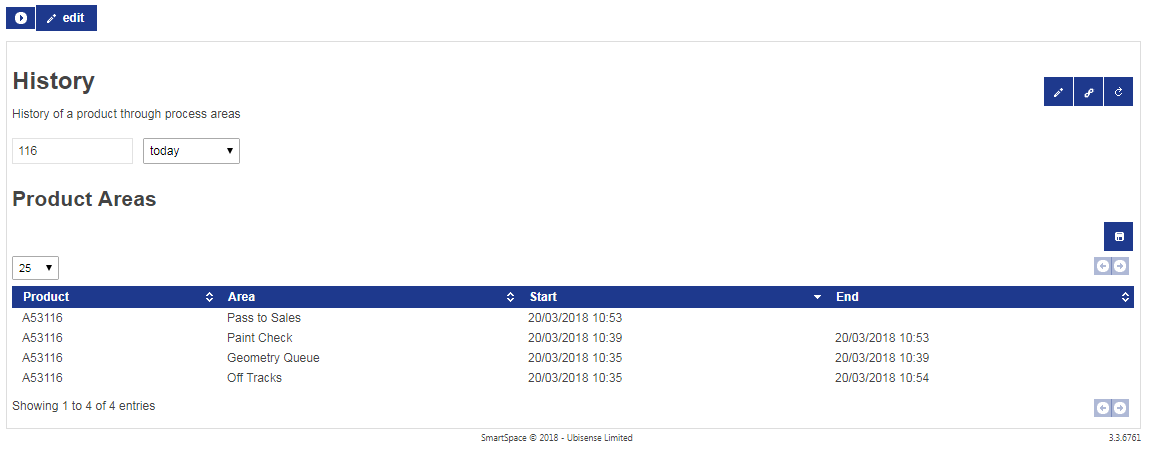
Buttons
The following buttons are on the top left:
 Click this to show the list of reports available to you.
 Click this to edit all reports. You must be an administrator to see this button.
 Click this dropdown to select the page size to display in a table.
The following buttons are on the right:
 This navigates to a link directly to the current report with the current parameters as entered.
 This refreshes the data in the report.
 This saves the current output of the report division as a file – a text CSV file for a table division, or an SVG image for a chart.
 These buttons are used to navigate through multiple pages of results.
 If shown this allows you to edit the report definition. You must be an administrator to see this button.
Table Sorting
You can click the header lines in a table to sort the table by that column. Click again to reverse the order of sorting. Hold down the Shift key and click to add another column as a secondary sort order.