Presenting data
The report editor provides a no-code environment for creating tables and charts based on queries. This section guides you through creating tables, charts and reports using the queries you created in Defining queries.
For more complex reporting requirements, you can create an HMI and call the reporting API to retrieve data to display.
Prerequisites
This section assumes that you have:
- Completed the steps in Logging to a database
- Completed the steps in User roles
-
Completed the steps in Defining queries
Tables
After you have created some queries, you can define tables to present the results as part of a report. You will create a table to display the Parts and their location history across Process Areas.
-
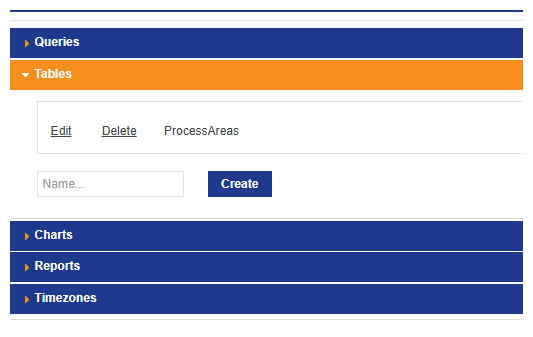
Open the Tables section of the report editor to create a new table.
-
Name the table ProcessAreas and click Create. The table is added to the list of available tables.
-
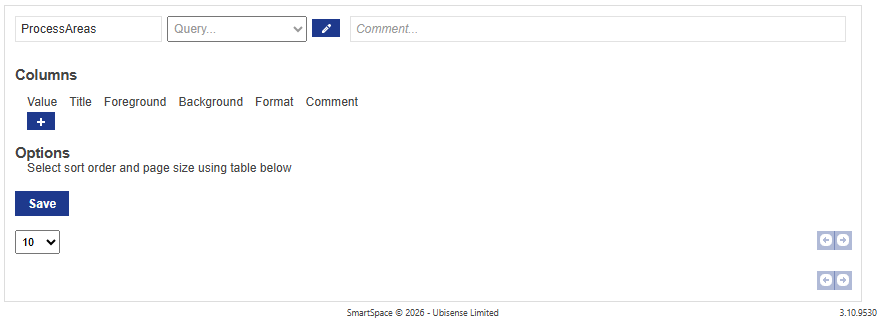
Click Edit to open the table editor. Read the Defining Tables documentation to learn more about the table interface.
-
Select PartsInProcessArea from the Query... dropdown menu.
-
Click the plus button
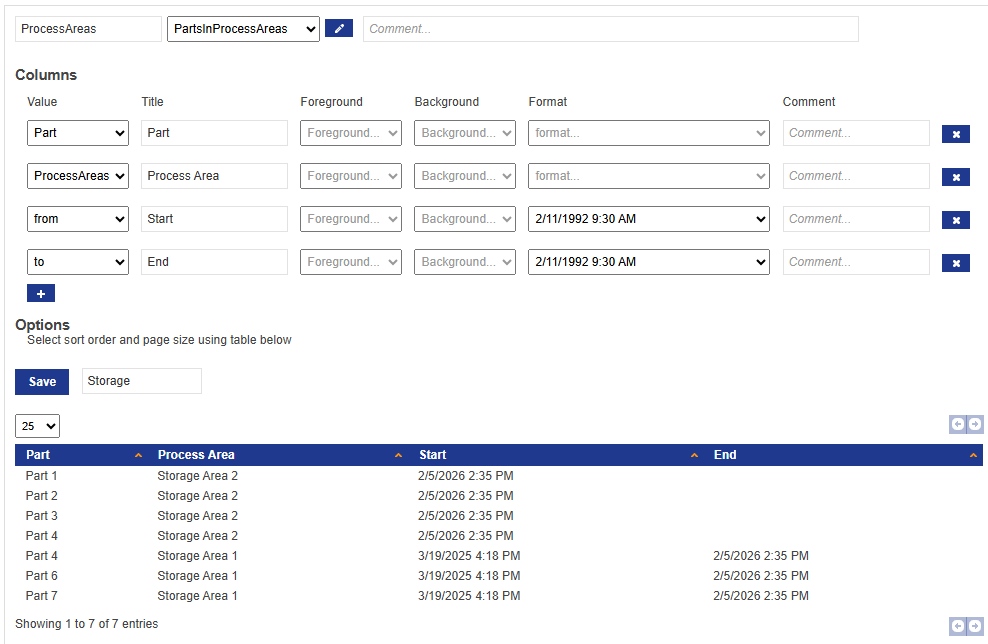
 under Columns to add columns for Part, Process Area, the time the Part enters the Process Area, and the time the Part leaves the Process Area.
 -
Change the format of the from and to columns to display the date and time.
-
You will notice that the ProcessAreaName parameter is available. Enter Storage to filter your results to only show Parts in Storage Area 1 or Storage Area 2.
-
Save your table.
Charts
Another way to display data from a query is using charts. The first chart you are going to create is a simple bar chart to display the number of times a Part has been in a Process Area.
-
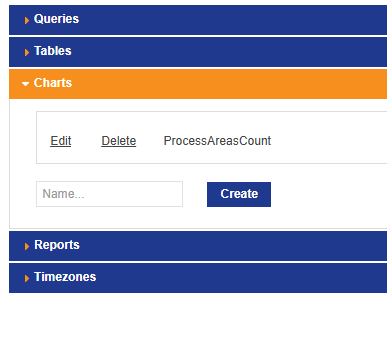
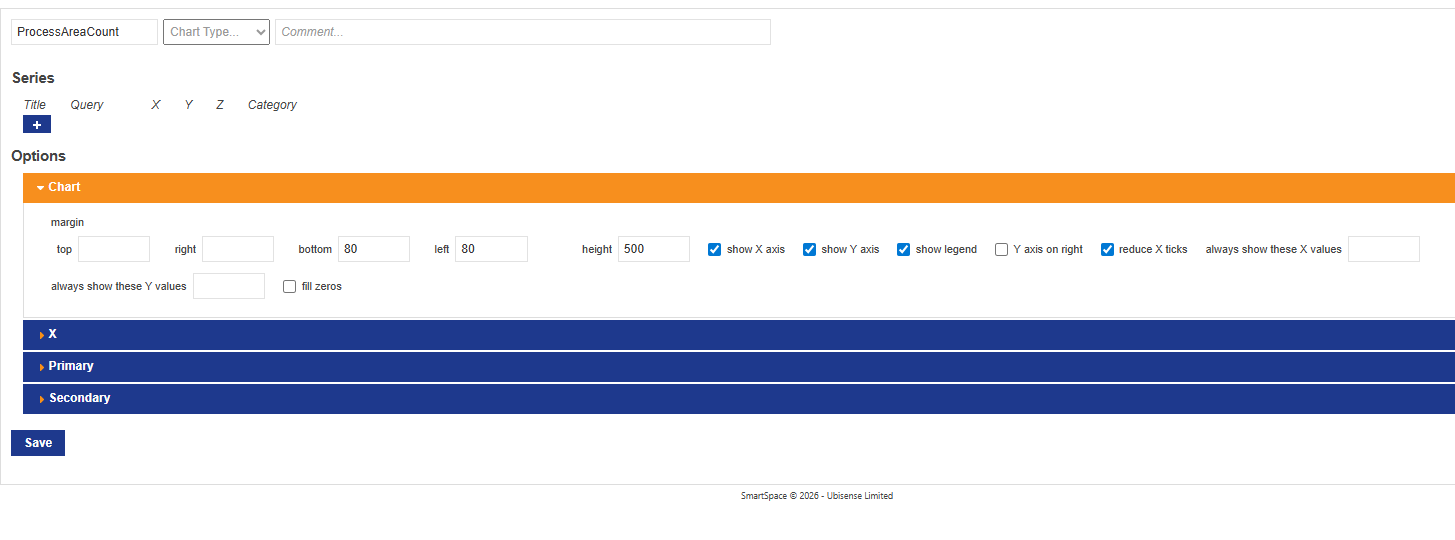
Open the Charts section of the report editor, name the chart ProcessAreasCount and click Create. The chart is added to the list of available charts.
-
Click the Edit button next to your chart name to open the chart editor. Read the Defining Charts documentation to learn more about the chart interface.
-
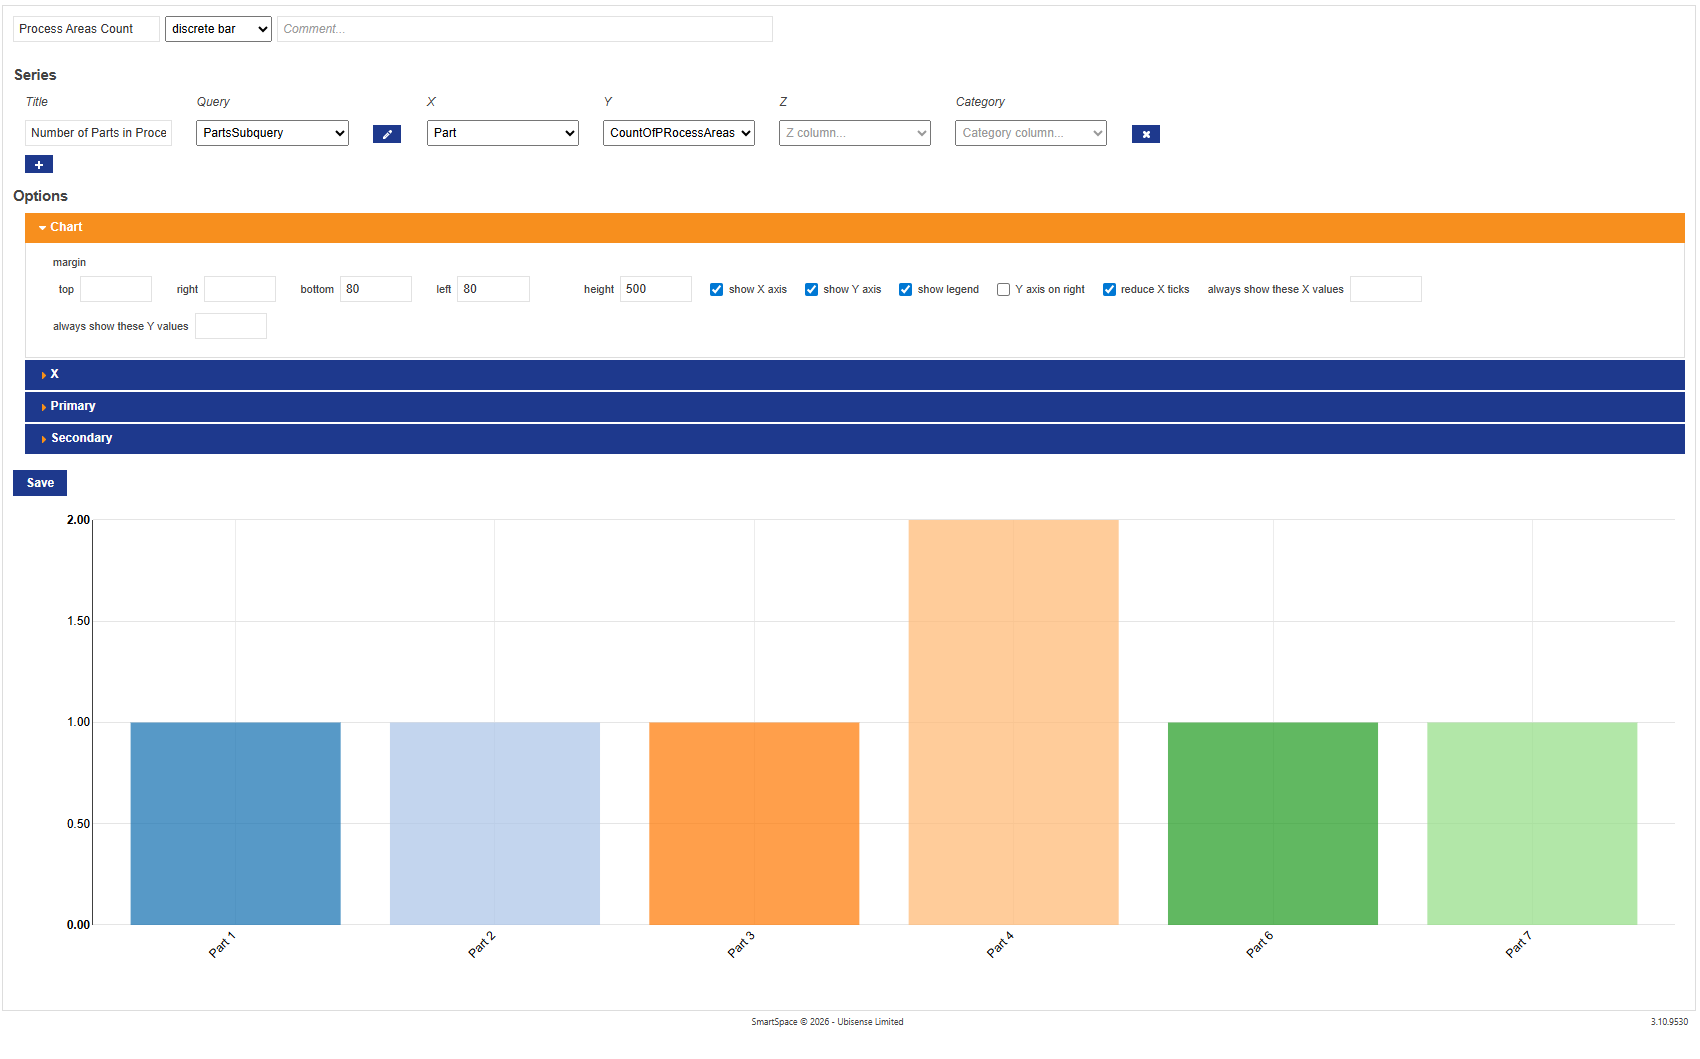
Select discrete bar from the available chart types.
-
Add PartsSubquery to the chart and enter a title.
-
Assign parts to the X axis and CountOfProcessArea to the Y axis.
As soon as the X and Y axis are set, the bar chart will appear at the bottom of the page.
It could also be useful to track the location history of each Part. The second chart you are going to create is a location history chart type.
-
Create a new chart called PartLocations.
-
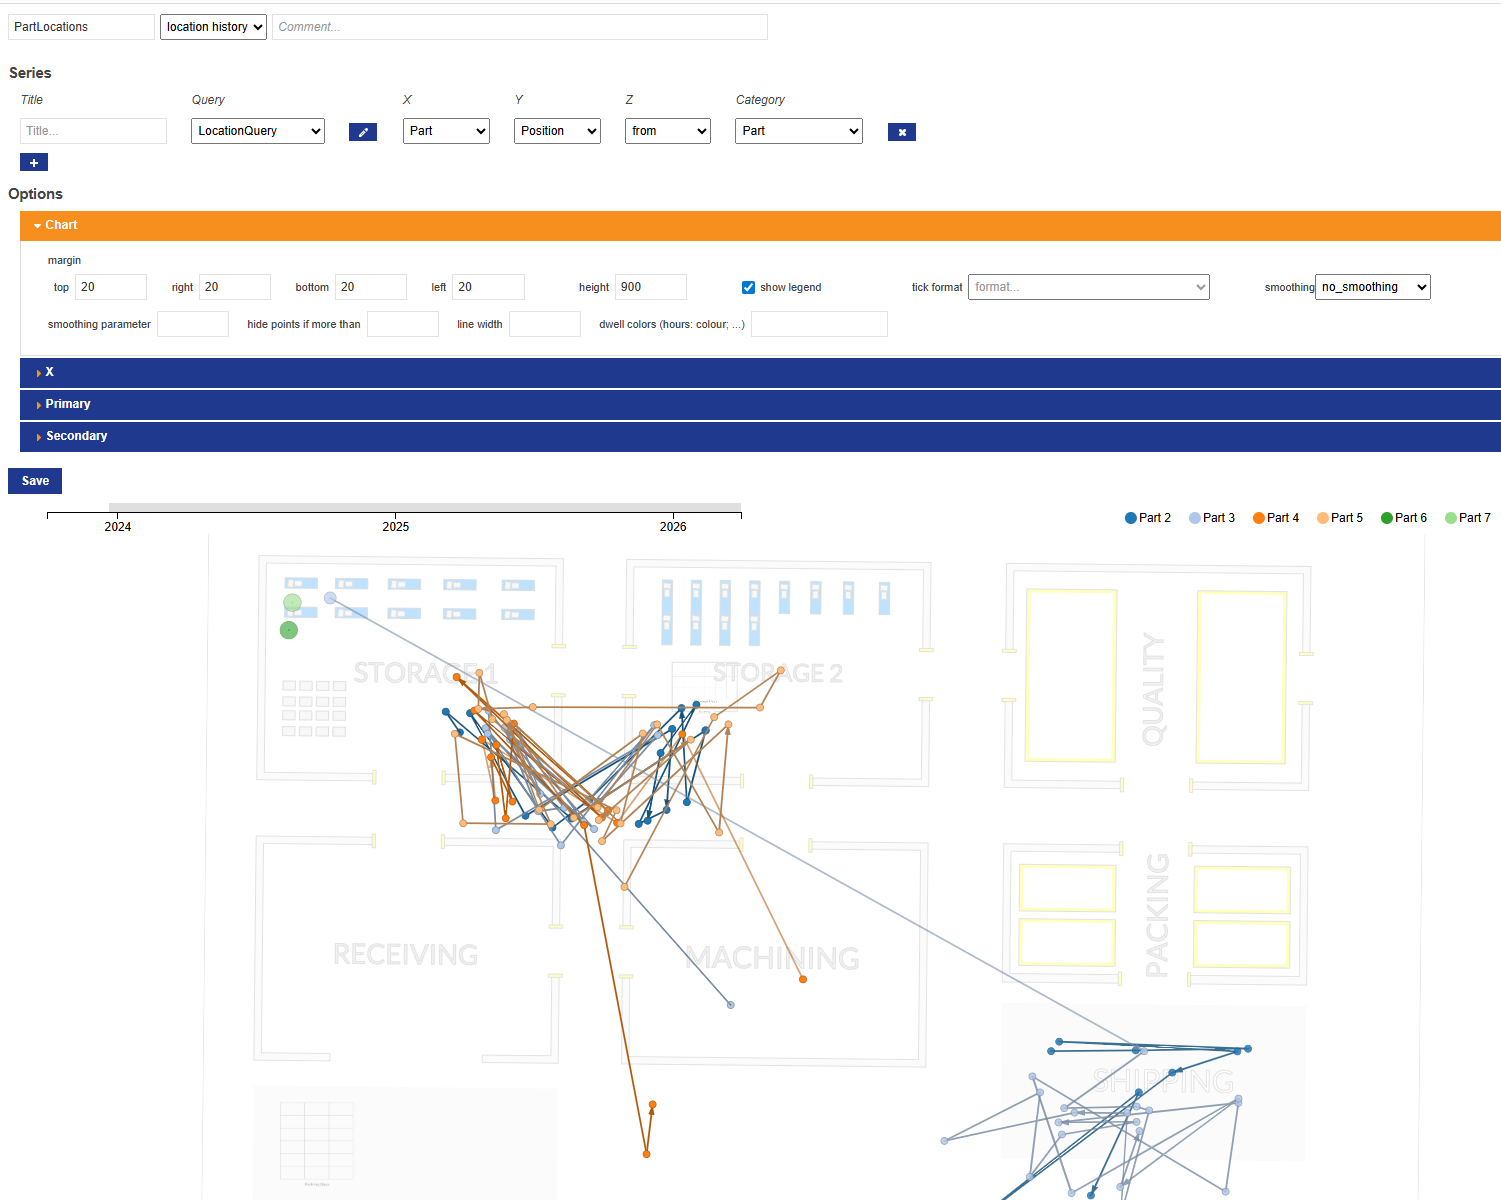
Select location history from the chart type dropdown.
-
Add LocationQuery to the chart.
-
Add Part to the X column, Position to the Y column, and from to the Z column.
-
Select Part as the Category.
-
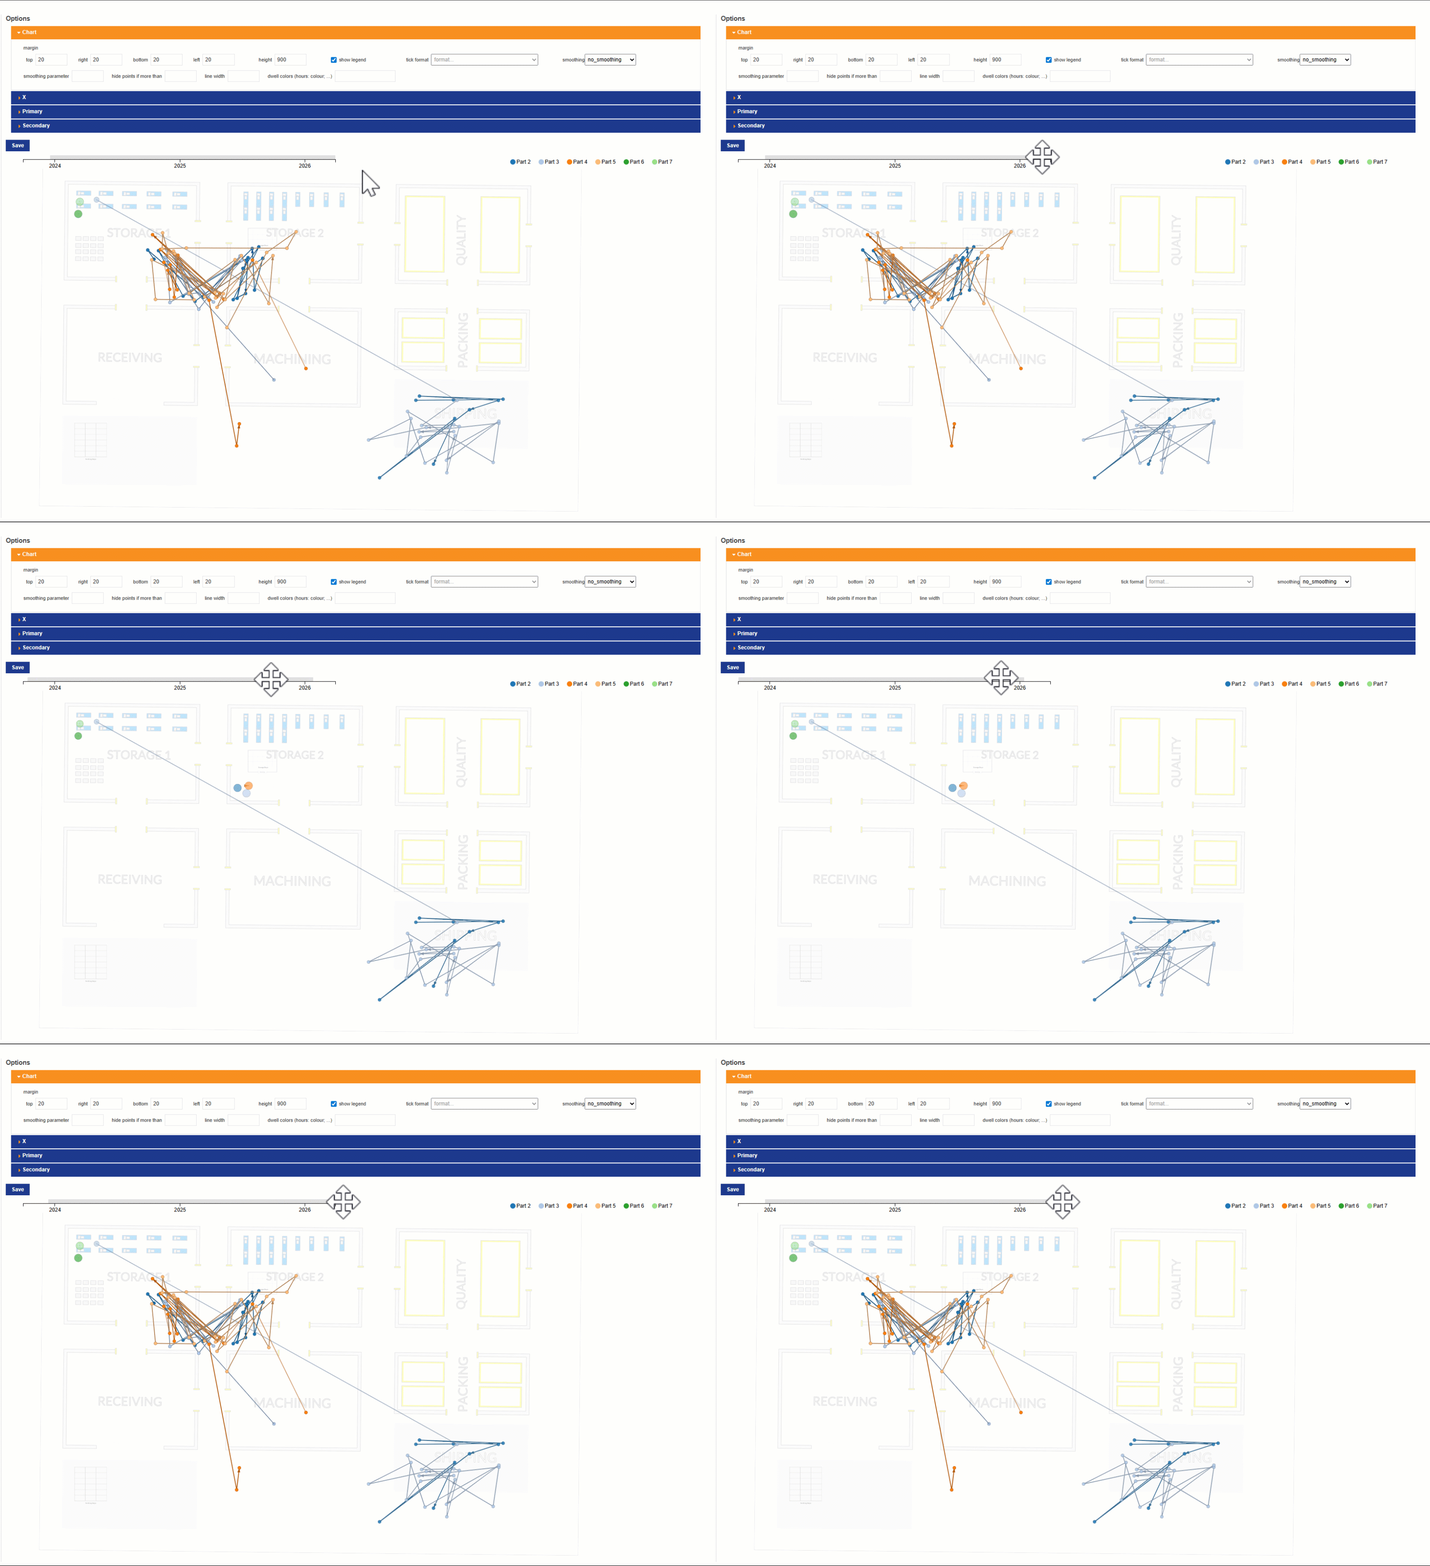
After you have selected your values, the chart will display at the bottom of the page.
-
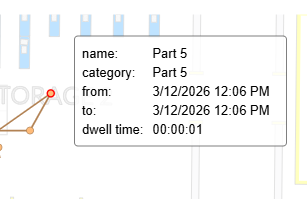
Click on a Part to view its location details.
-
To change the date range, move the slider at the top of the chart.
-
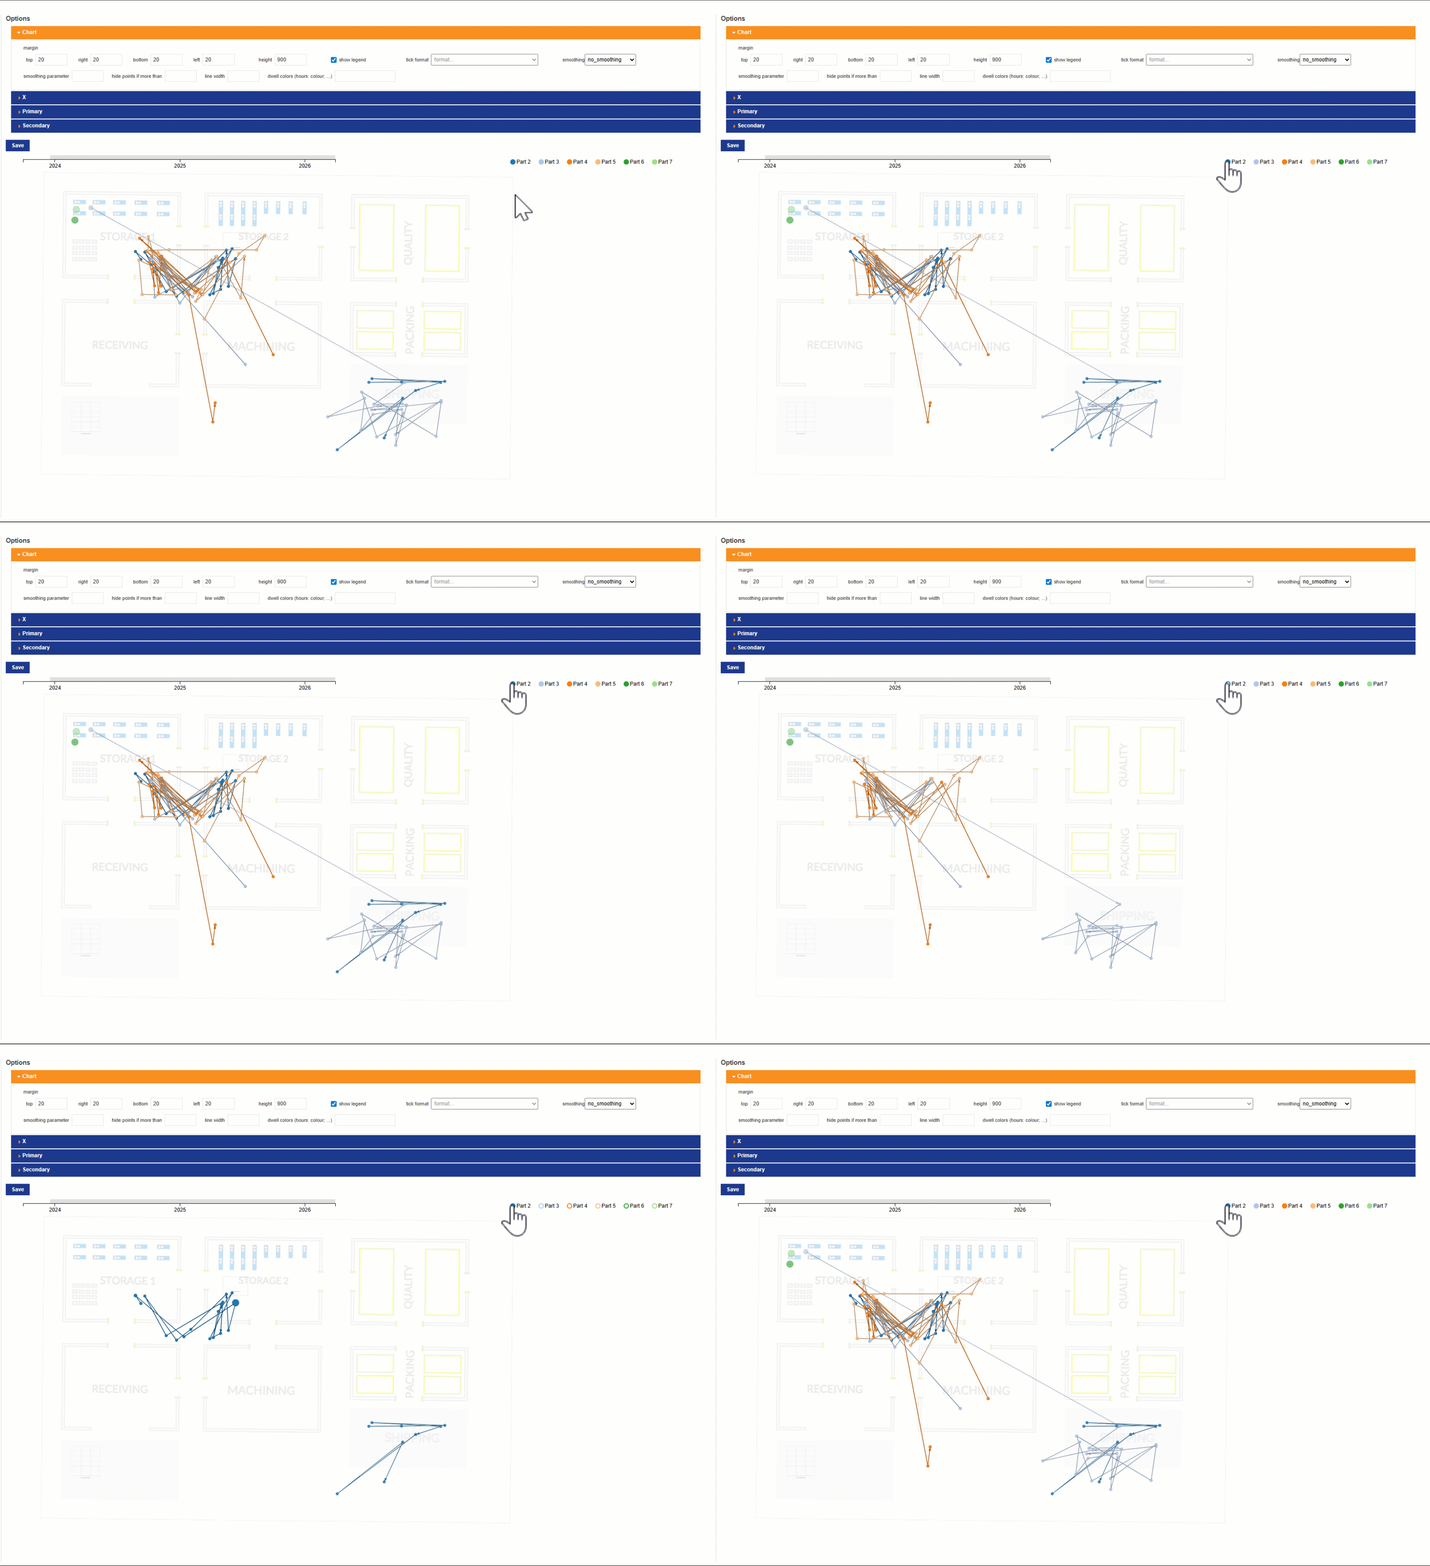
Remove a Part from the chart by clicking on the corresponding Part in the legend. Double-click on the Part to select only that Part.
Refer to the Available chart types to learn more about all chart types.
Reports
The final way to present your data is with a report. A report consists of a number of divisions, each of which is either a table or a chart, along with parameters and filters that control what subset of the data is displayed, and the roles for which the report is visible.
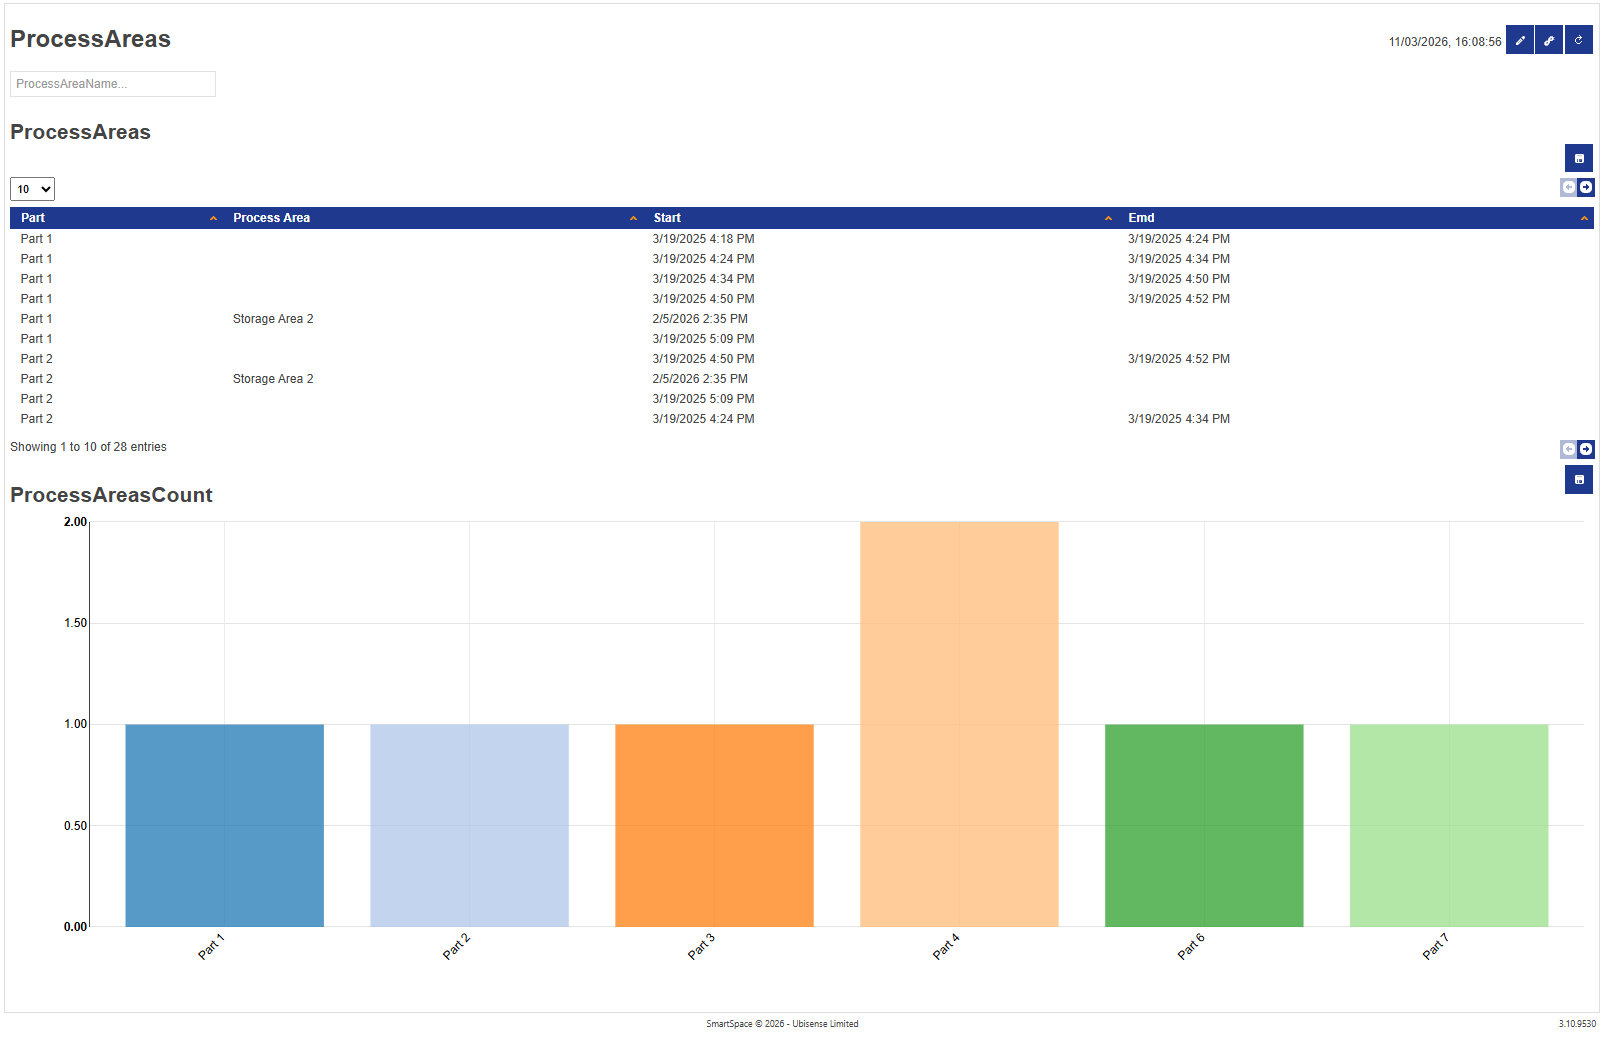
You are going to create a report that displays the Process Area Count bar chart and the ProcessAreas table.
-
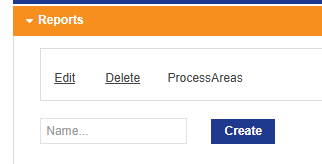
Under the Reports dropdown, create a new report called ProcessAreas. The report is added to the list of available reports.
-
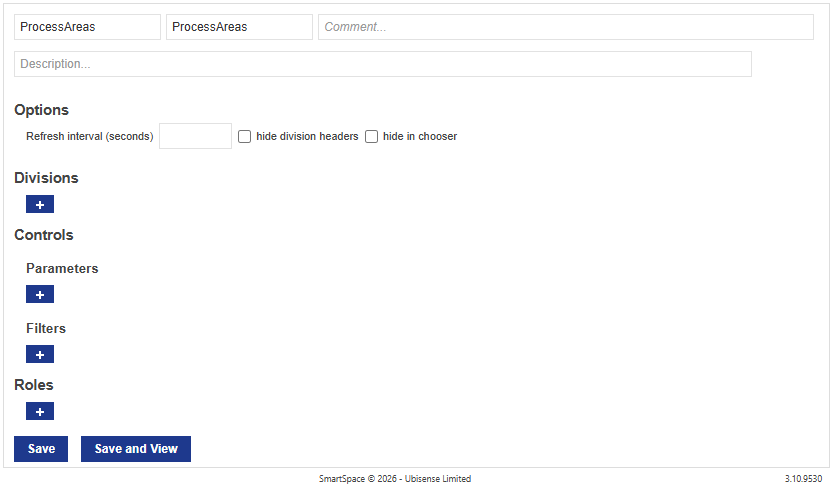
Click Edit to open the report editor. Read the Defining Reports documentation to learn more about the reports interface.
-
Add ProcessAreas and ProcessAreasCount as divisions.
-
Add the ProcessAreaName parameter. Leave the Choose from... dropdown empty because this would be used if you had a subset of process areas to choose from.
-
Click Save and View to view your report. Use the input field to filter by Process Area.
Roles
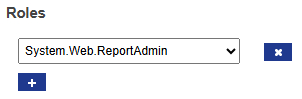
To make the report visible to a given role of user, click the “+” button under the Roles section, and then pick the role from the dropdown box. Until a report has been added to roles, it will not appear under the Reports section of the web site to anyone but the administrator. Note that the administrator role (Ubisense.SmartSpace.Administrator) can view any report, regardless of the roles configured.
Assign the role System.Web.ReportAdmin to your report.
Accessing your report
After saving your report, and assigning the System.Web.ReportAdmin role, the reports is available to you on the website.
-
Click on Reports to go to the reports page.

-
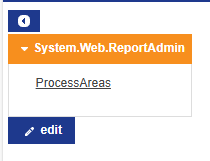
You should see the ProcessAreas report under the dropdown for the System.Web.ReportAdmin role.
-
Click on the report to view it.