Defining queries
Now that you have the system recording data as it changes inside SmartSpace, and the appropriate users and roles configured, the next thing to do is to write some queries that allow you to pull the data and build charts, tables, and reports. This section shows you how to create queries that can be used later on to visualize the data and create reports. Queries are defined inside the reports editor, which is on the SmartSpace web site.
This section will guide you through:
- Building queries and using filters and groups to track which Parts are in which Process Areas
- Building subqueries to group information from different queries together
- Defining parameters that allow user input
Prerequisites
This section assumes that you have:
- Completed the steps in Logging to a database
-
Completed the steps in User roles
Building queries
The reports editor is available to you on the SmartSpace web site now that you are a member of Ubisense.SmartSpace.Administrator. From there, you can use the query editor to build queries to extract information from your databases. The query editor takes queries and turns them into SQL.
The queries built in this section will:
-
Retrieve the name of the Part, the name of the Process Area, the time the Part entered the Process Area, and the time the Part left the Process Area
-
Display the number of times a part has entered a process area per day
-
Display the location of each Part and the time the Part entered and exited that location
Create a query
The first query you are going to build will retrieve the name of the Part, the name of the Process Area, the time the Part entered the Process Area, and the time the Part left the Process Area.
-
Browse to localhost/smartspace in your browser and log in.
-
Select Reports.

-
Click the edit
 button to open the reporting page.
 -
Under the Queries section, enter the name PartsInProcessAreas and click Create. This will add the PartsInProcessAreas query to the list of queries. Any existing queries will appear here.
-
Click Edit next to your query.
-
Optional: enter a comment in the Comment... field to describe your query.
Sources
The Add Source dropdown lists any existing queries and all of the properties currently logged to the property history. The properties name of 'Part', name of 'Process Area' and 'Process Area' contains 'Part' are available as sources.
-
Add the name of 'Part': String, the name of 'Process Area': String and 'Process Area' contains 'Part': Bool as sources. Your sources will appear at the top of the page:
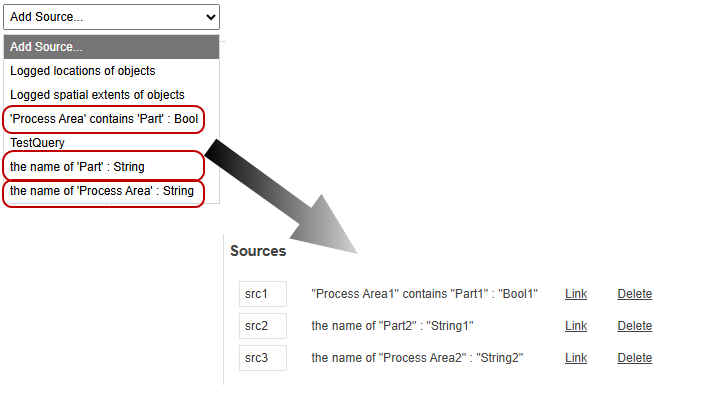
-
Click the Link button to link fields between sources. Only compatible fields from other properties are available to select. Use the Link button to declare that Part2 in src2 is the same as Part1 in src1, and Process Area1 in src1 is the same as Process Area2 in src3.
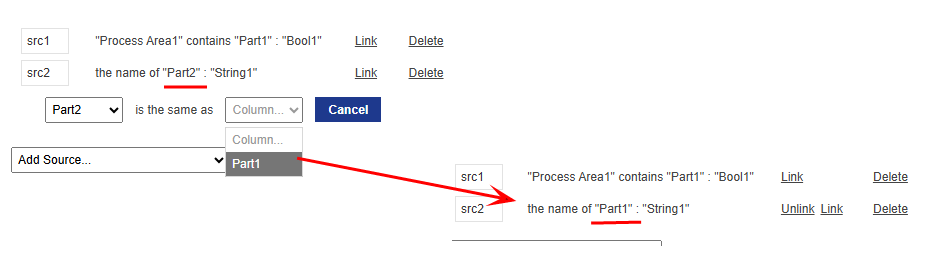
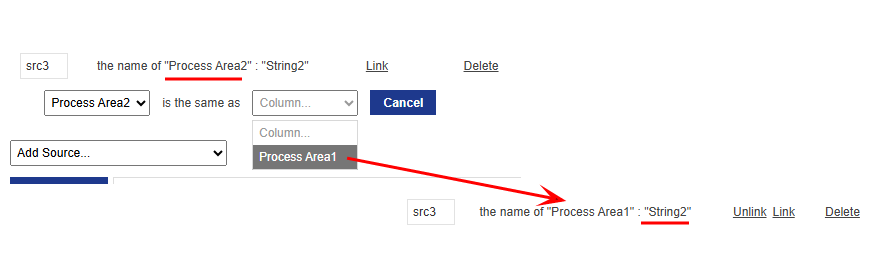
This operation is known as a left join. In this example, for each row in src1, the database will find all values that match that row in src2 and return the matching rows in the results of the query. If there are no matching values, then NULL is returned.
The order of your linked sources determines which rows will be returned: you will get all the rows from the first source you declare. In this case, all the rows for 'Process Area 1' contains 'Part1' are returned. By linking src2 to src1, still only the number of rows for 'Process Area 1' contains 'Part1' are returned. If src2 wasn't linked to src1, then the number of rows for src1 multiplied by the number of rows for src2 are returned.
Results
To view data from your sources, you need to add results.
-
In the Results dropdown, click the add
 button. Add four new results. Click on each result and edit the name in the result field so that you have:
-
Part
-
ProcessArea
-
from
-
to
These results are going to return the name of the part, the name of the process area, the time that the part entered the process area, and the time that the part left the process area.
Ensure that from and to are in lowercase. They will be used when creating charts in Presenting data and won't work correctly if they aren't in lowercase. -
-
Click on the result Part to open it in the editor window.
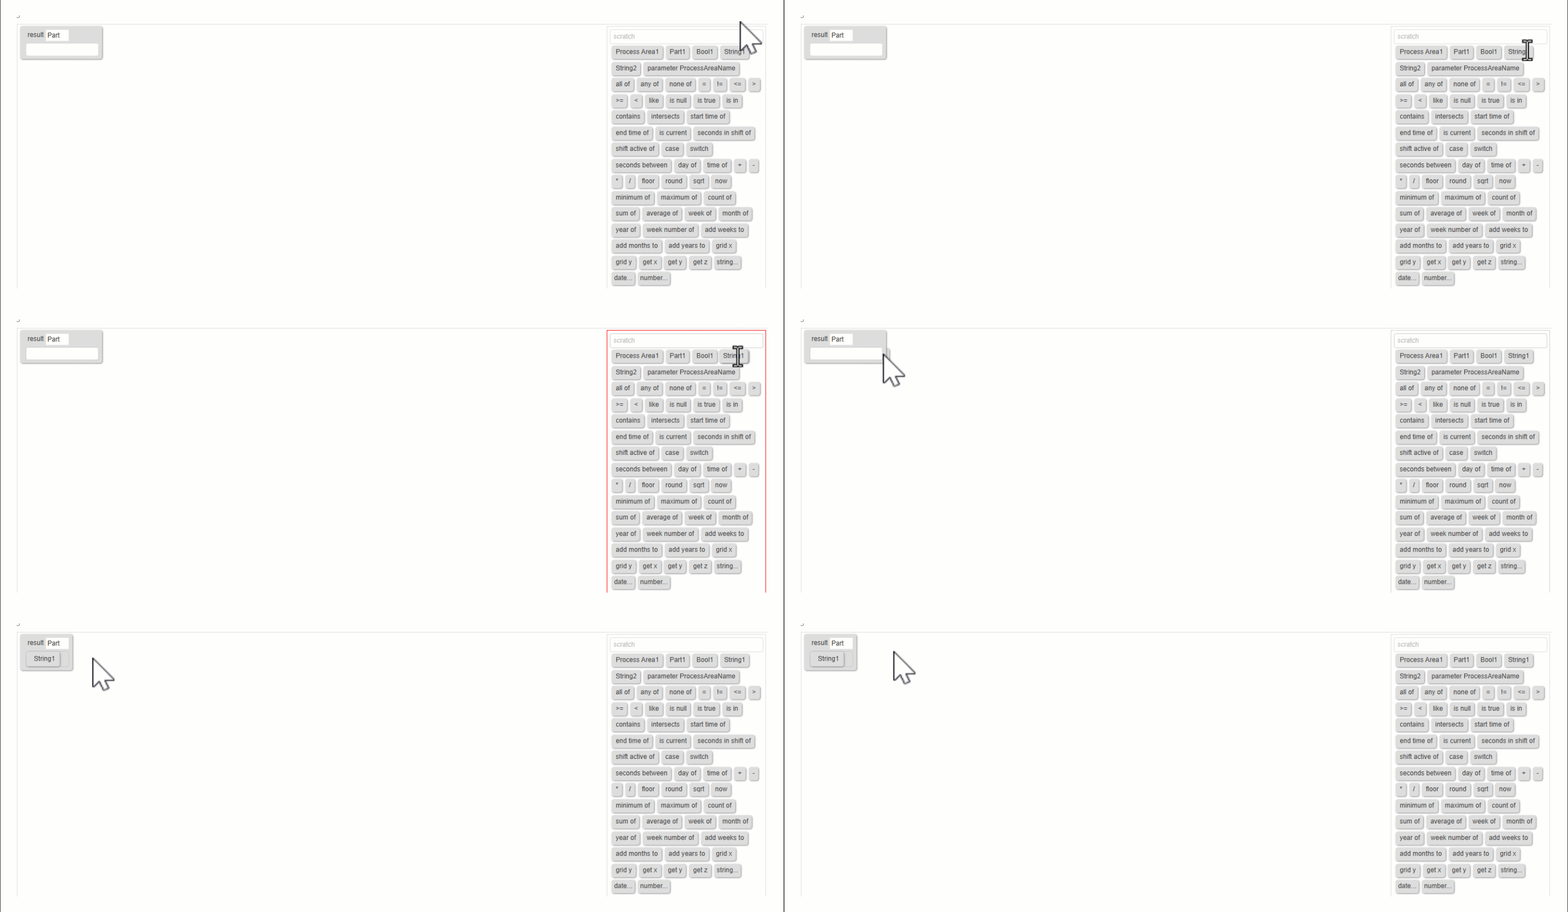
You can see which values are available from the toolbox by clicking in the empty slot. All available values display with a red circle.
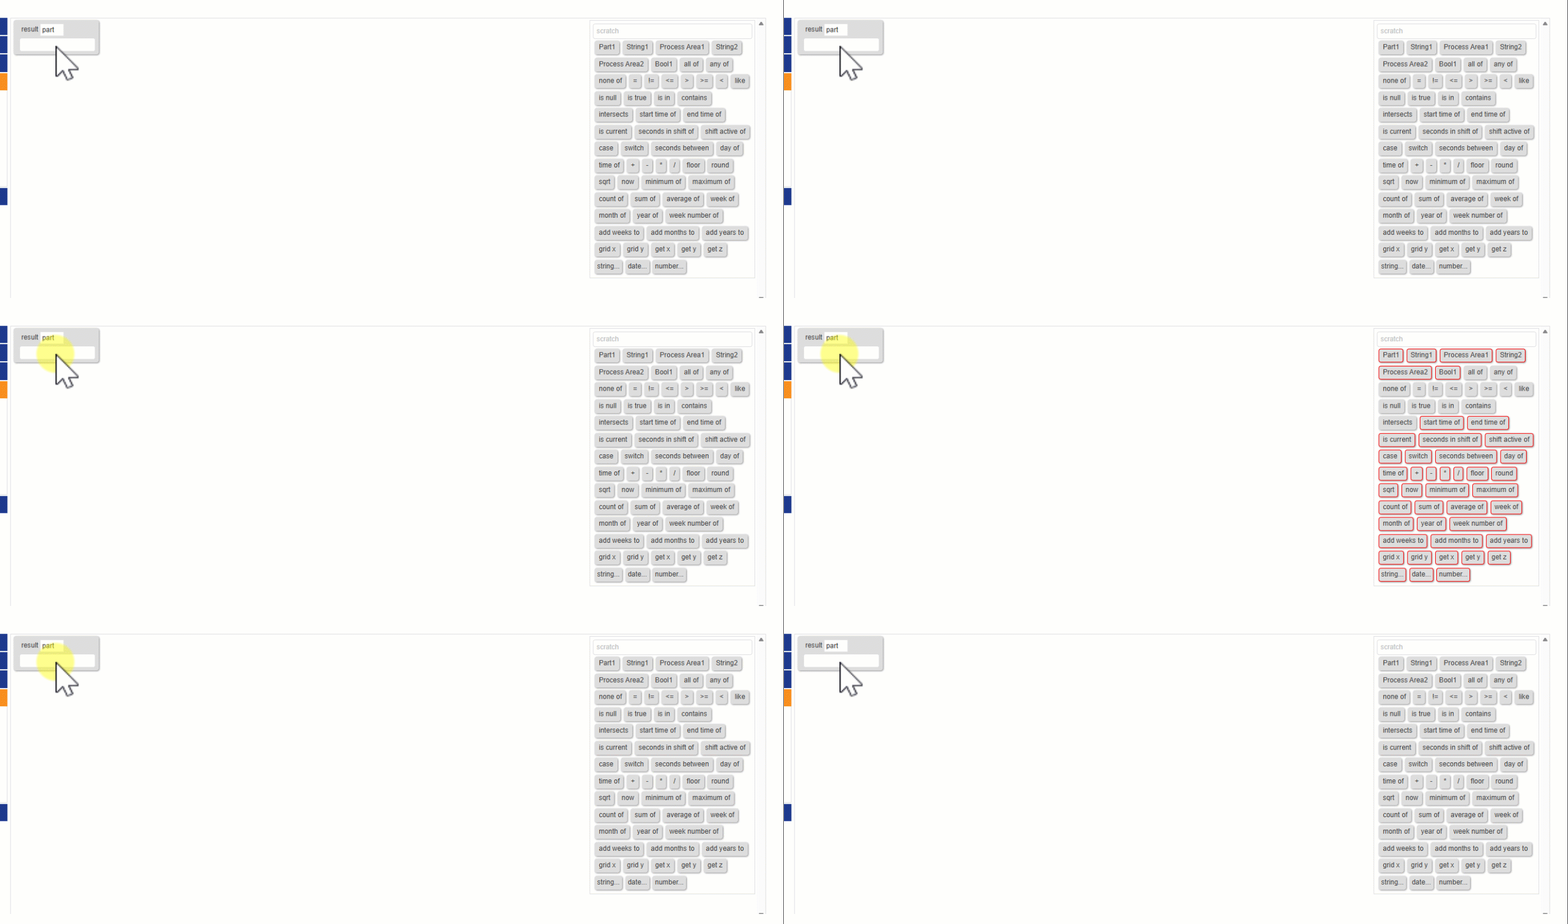
-
Queries are built by dragging and dropping the appropriate values from the toolbox (view the Toolbox elements for more information).
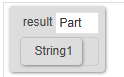
Use the elements in the toolbox so that:
-
Part returns String1: the name of the Part
-
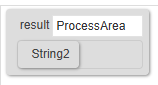
ProcessArea returns String2: the name of the Process Area
-
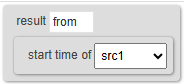
from returns the start time of scr1: the time the property row was created
-
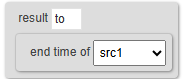
to returns the end time of src1: the time the property row was deleted
The from and to results will only work if the table is logged temporally because they use the L_FROM and L_TO column. -
Testing the query
-
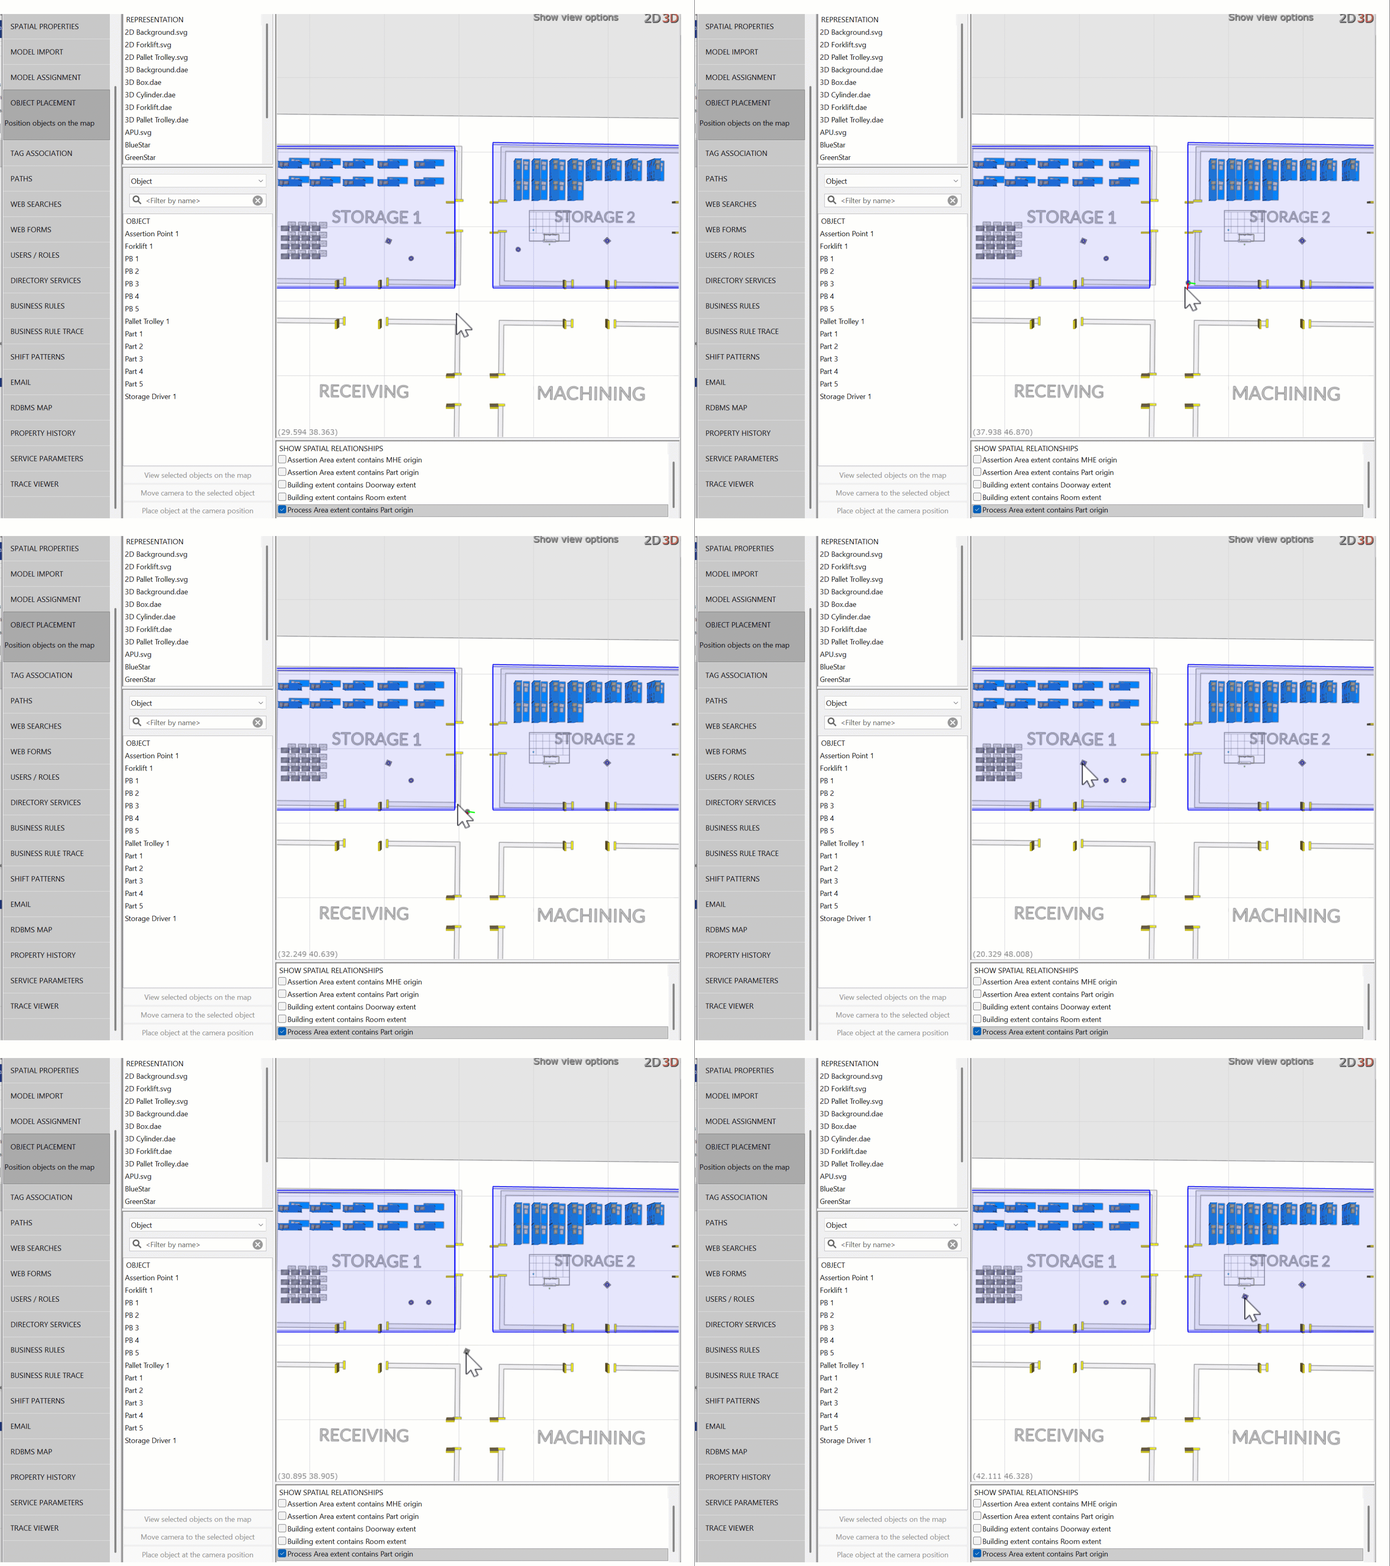
In order to see results for the query you just built, you need to move Part objects in and out of the Process Areas. Move multiple Part objects between the storage areas and packing areas.
-
Go back to the query builder and click Test. You should see your results populate at the bottom of the screen.
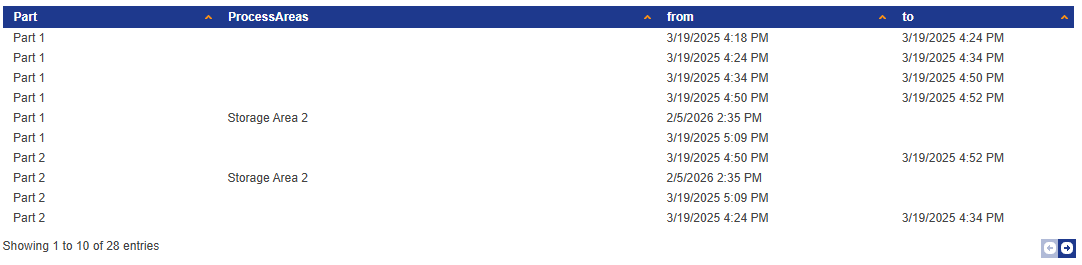 If the from and to columns aren't populating make sure you have a timezone selected in the Timezones section of the reporting site.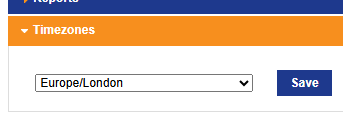
If there are no timezones available, make sure you have installed the Windows ASP.NET Core Runtime Hosting Bundle as described in Installing SmartSpace Web. If the Hosting Bundle is installed, and still no timeszones are available, restart the Timezone loader service in Service Manager.
Filters
Filters can be added to refine your results. Add a filter to remove rows from the query that are not current. You are going to add filters to a copy of the PartsInProcessArea query.
-
From the query editor, with PartsInProcessArea open, change the name of the query from PartsInProcessArea to PartsInProcessAreaFiltered to create a copy of the query. After you have changed the name and clicked Save, the previous query will be saved as a copy with the old name, and you can continue editing the query with the new name without affecting the original query.
-
Under the Filters dropdown, click where. This allows you to add a where clause.
-
Drag is true from the toolbox into the where clause.
-
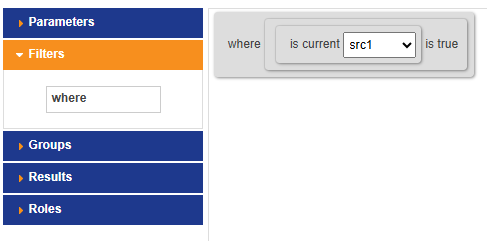
Drag is current into the where clause.
The is current element returns rows from L_TO that are null for the given property. L_TO is only populated when the property leaves the area.
-
Select src1 (the temporal item) from the dropdown in the clause.
-
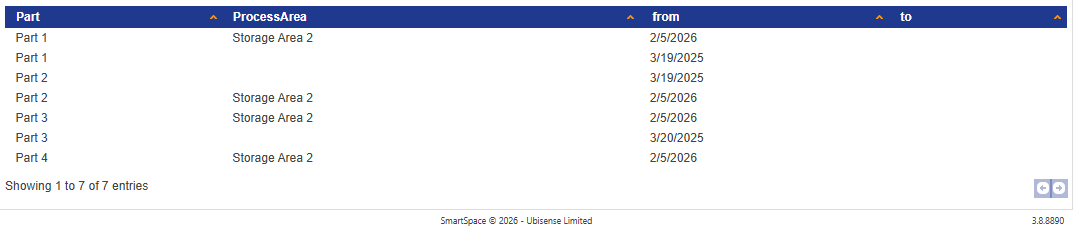
Click Test and you will see that the results are showing only the rows where the to column is null.
-
If you take one of the Parts out of its Process Area and test the query again, you will see that the corresponding row is removed from the query results.
Grouping
Grouping allows you to group data from multiple rows and compute aggregates by using the aggregate functions. Add a grouping clause to count the number of times a Part has been in a Processing Area.
-
In the Groups dropdown, click group.
-
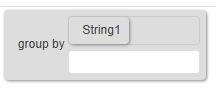
Drag String1 from the toolbox into the grouping clause.
-
You can't have anything that's not an aggregate or the thing that you're grouping by in the results. So, remove ProcessArea, from and to from the Results. Delete the filter, too, because it is no longer applicable. Filters are deleted by dragging the components of the clause back to the toolbox.
-
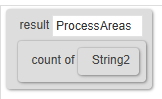
Add a new result called ProcessAreas.
-
Drag count of from the toolbox into the ProcessAreas expression.
-
Drag String2 from the toolbox into the ProcessAreas expression.
-
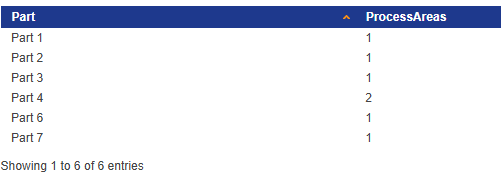
Test your updated query to see the number of times each Part has been in a Process Area.
-
Move one of the Parts into different Process Areas and test your query again to see the count of ProcessAreas increase.
The results show the count of the number of rows that had that property, not explicitly the count of the unique instance of that property. -
Save your query.
Subqueries
You can structure your queries by building on other queries. You will create a new query and use PartsInProcessAreas as the source and group the subquery to display the number of times a part has entered a process area each day.
-
Create a new query called PartsSubquery.
-
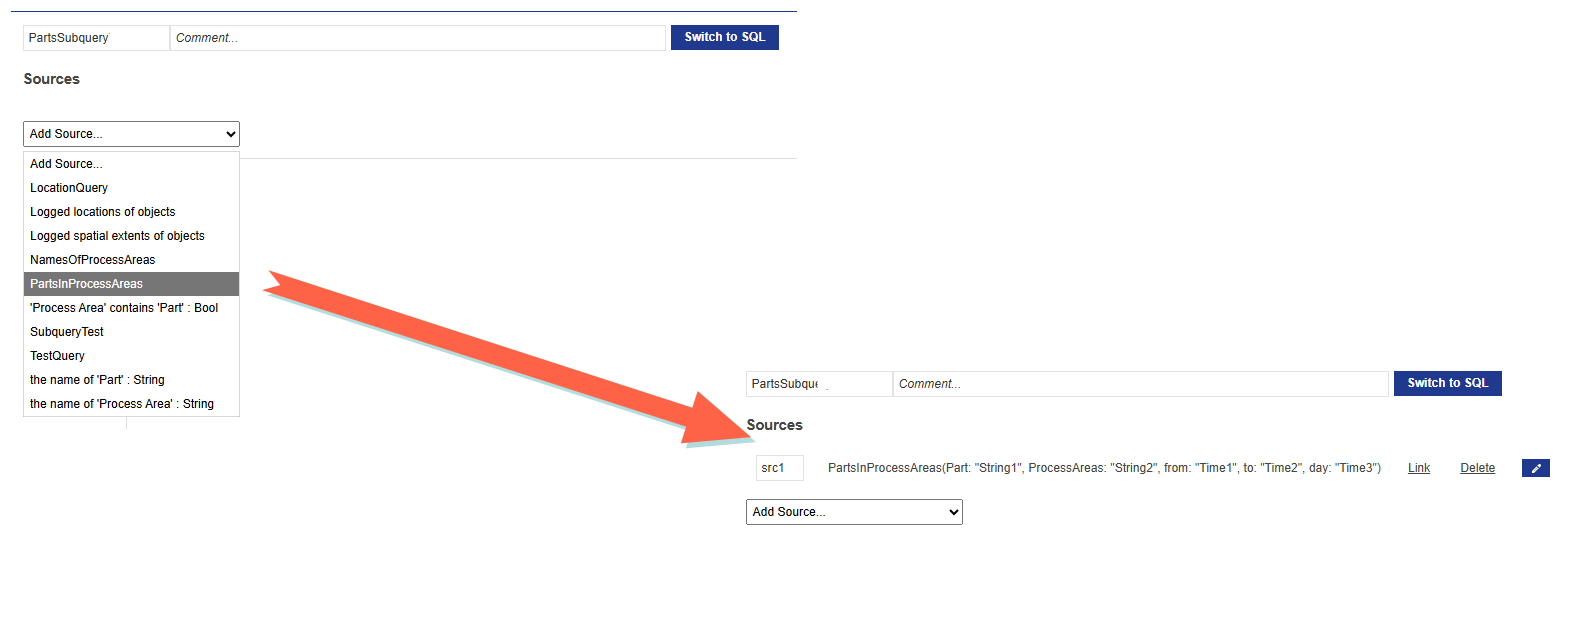
Add PartsInProcessAreas as a source.
-
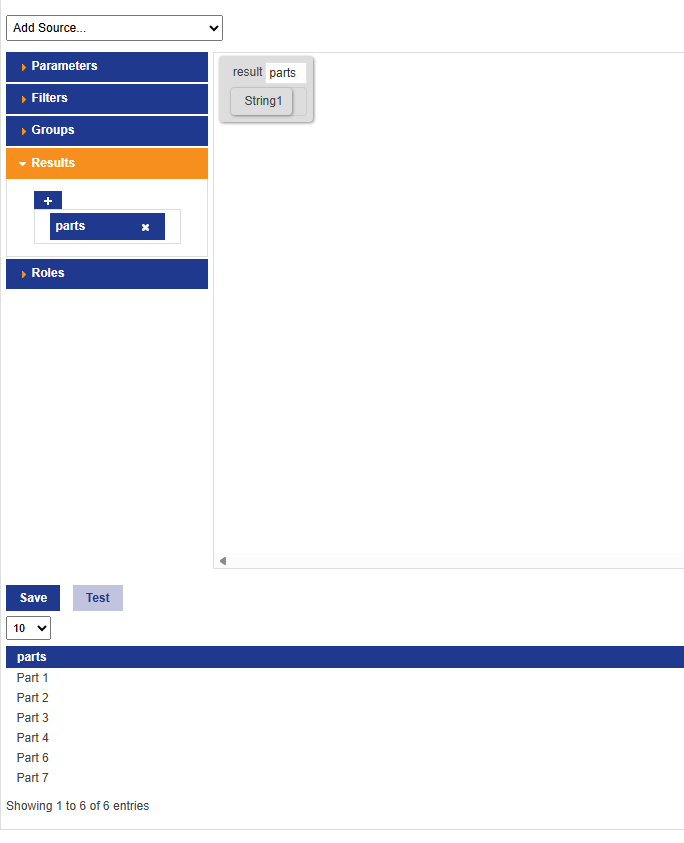
To test the query, add the name of the Parts as a result.
Grouping subqueries
Similarly to queries, you can group subqueries. To test grouping with subqueries, you are going to display the number of times a part has entered a process area per day.
-
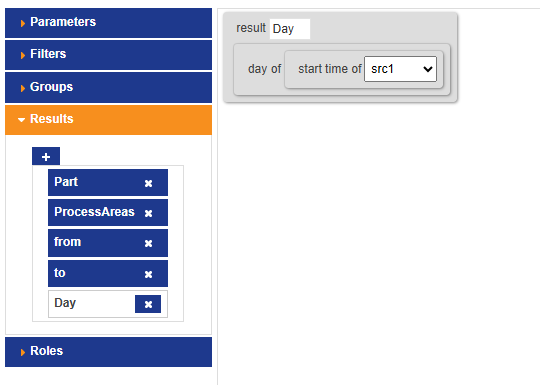
In the PartsInProcessAreas query, add a new result called Day that displays the day of a part entering a process area.
-
In PartsSubquery:
-
Group by String1 and Time3.
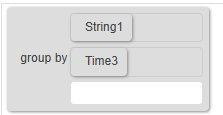
-
Add a new result called CountOfProcessAreas that returns the count of Process Areas.
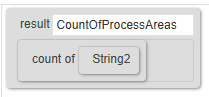
-
Add a new result called Day that returns the day of a part entering a process area.
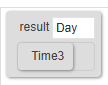
-
-
View the results of PartsSubquery to see the number of times a part entered a process area each day.
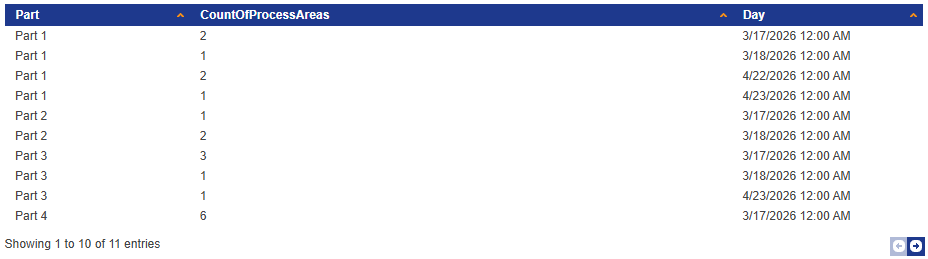
-
Save your query.
Location queries
Location queries allow you to retrieve location data from your logged locations.
-
Create a new query called LocationQuery.
-
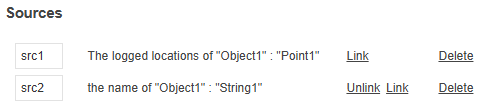
Select Logged locations of objects as a source.
-
Select the name of 'Part': String as a source and link Part1 to Object1.
-
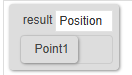
Create two results:
-
Part: returns String1
-
Position: returns Point1
-
-
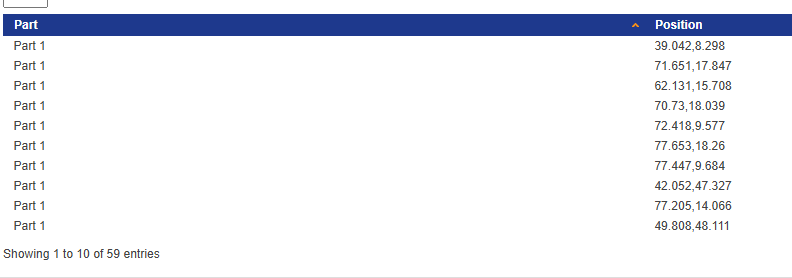
Test your query to see the X and Y values of each Part location.
-
Add the start time and end time of src1 and test your query again to see your updated results.

Filters
If you want to filter the results to exclude a certain Part, add a where clause to filter the results to only show instances where String1 that does not equal "Part 1", for example. In this case, the where clause would look like:
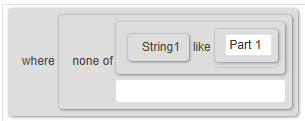
To build this clause, drag and drop none of and like into the where clause. Then, drag and drop String1 into the first expression box, and then string... into the second expression box to enter your own text. Enter Part 1 into the expression box.
Now, when you test your query again, you will see that Part 1 is no longer returned.
Extracting X, Y, and Z values
Even though you can see the X and Y values by returning the point as a result, if you want to compute something with them, you can use get x, get y, and get z to extract them as separate columns. To do this:
-
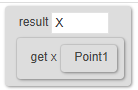
Create a new result called X.
-
Drag and drop get x into the result.
-
Drag and drop Point1 into the point field.
-
Repeat the process for Y and Z values, using get Y and get Z respectively.
-
Test your query to see the X, Y, and Z values in the table.
 The query returns the full number for the X, Y, and Z values, but the table displays a rounded number, which is why the separate X and Y values look different to the X and Y values under the Position column.
 -
Save your query.
Query parameters
Parameters provide a way to run your query with a given input. A query can be used with explicitly defined parameters that allow you to define how they work and what they do in the logic of the query.
A query can also be executed with a filter applied to any result column of a query or subquery. This supports a limited set of filtering:
-
A string contained in a string column
-
A range of date/times for a date column
You are going to add a parameter to the PartsInProcessArea query so that you can enter a Process Area name when executing the query.
-
Under the Parameters dropdown, add a new parameter called ProcessAreaName.
-
Select String from the list of options in the parameter.

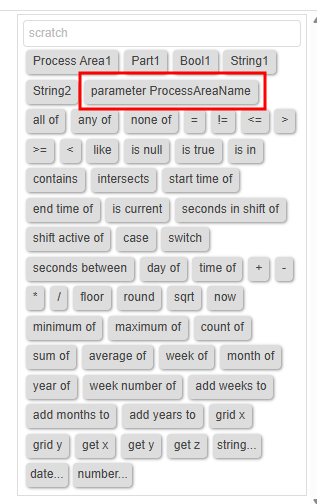
After you add the parameter, an input box appears at the bottom of the query editor and the parameter appears in the toolbox for you to use in filters and result expressions:
-
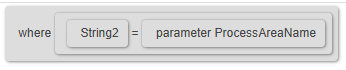
Add a where clause so that String2 is equal to the ProcessAreaName
-
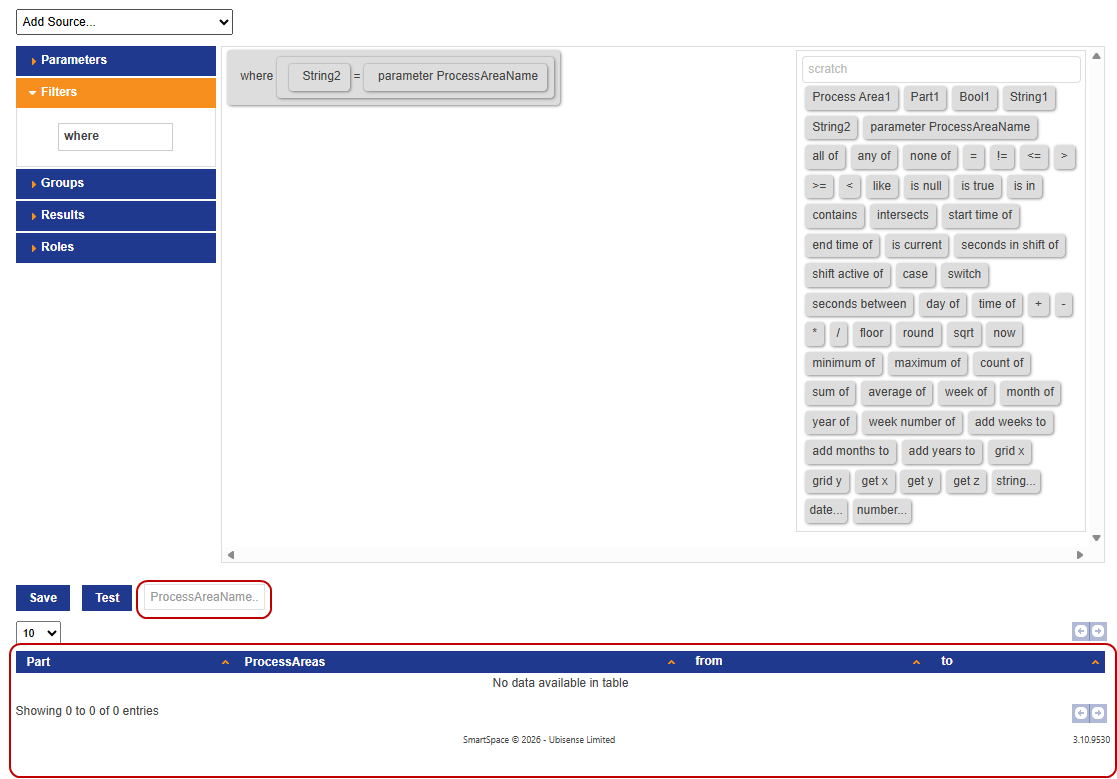
When you test the query now, you will see that no data is available in the table. This is because no input was given when executing the query.
-
Enter the name of one of the Storage Areas in the input field and test the query again. This time the results show only those rows where the name of the Process Area is equal to the string given in the input field (in this case, Storage Area 1).

-
If you want to return all Process Areas that start with the word "Storage", you can change your where clause to where String2 like parameter ProcessAreaName + % . See the video below to see how to build this query.
When you test the query and enter "Storage" in the input field, you will see results for all Storage Areas.
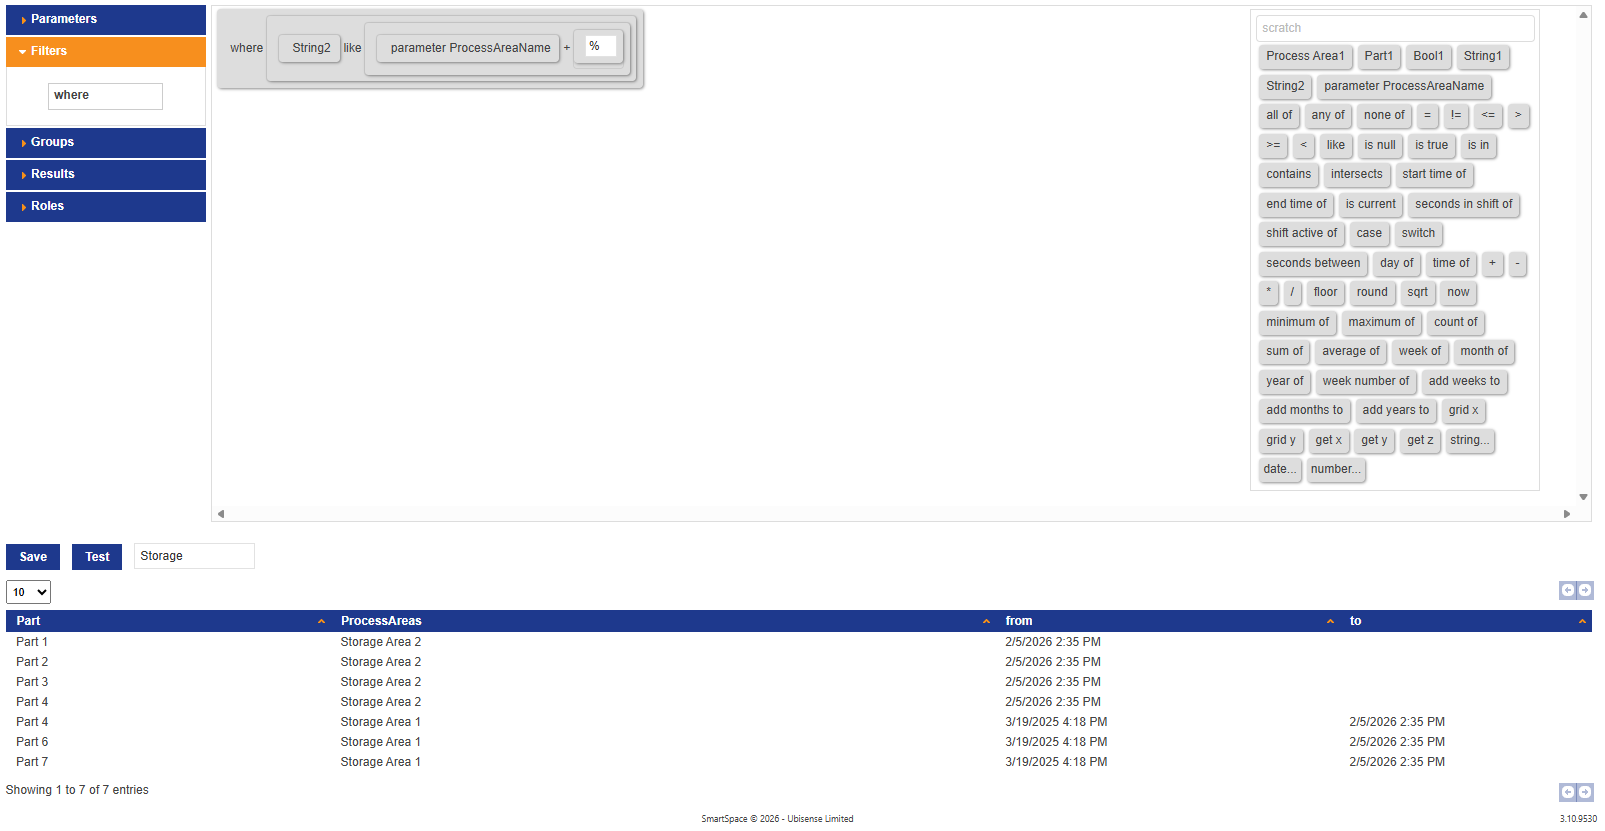
-
To use this parameter when creating charts and reports, you need to edit the clause so that the chart or report still returns results if the input field is left empty. To do this, use the any of element in your clause. Follow along with the video below to edit your clause using any of.
-
Save your query.
Query roles
Query execution is controlled by Roles in SmartSpace Config. A query can be executed by a user if they are:
-
In a role that is explicitly added to the query in the query editor/Roles section, or
-
In a role that is added to a report that contains the query as a source in a chart or table
Queries can be executed directly by using the web APIs. For example, you might write an HMI that does this. For this kind of direct execution, the user must be in a role saved on the Query.
Queries can also executed as part of a report by defining a chart or a table that uses the query, in which case the user must be in a role saved on the Report. This is covered in Presenting data.
Next steps
Move on to Presenting data to learn how to use your queries to create tables, charts, and reports.