Business rule trace
Use the Business rule trace workspace to trace the behavior of published rules and events. For a detailed explanation of using this feature, see Rules engine trace
Click on BUSINESS RULE TRACE to display the workspace.
You can zoom in and out by using either Ctrl+mouse wheel or Ctrl+Plus sign and Ctrl+Minus sign.

Features of the Business rule trace workspace are described in the following sections.
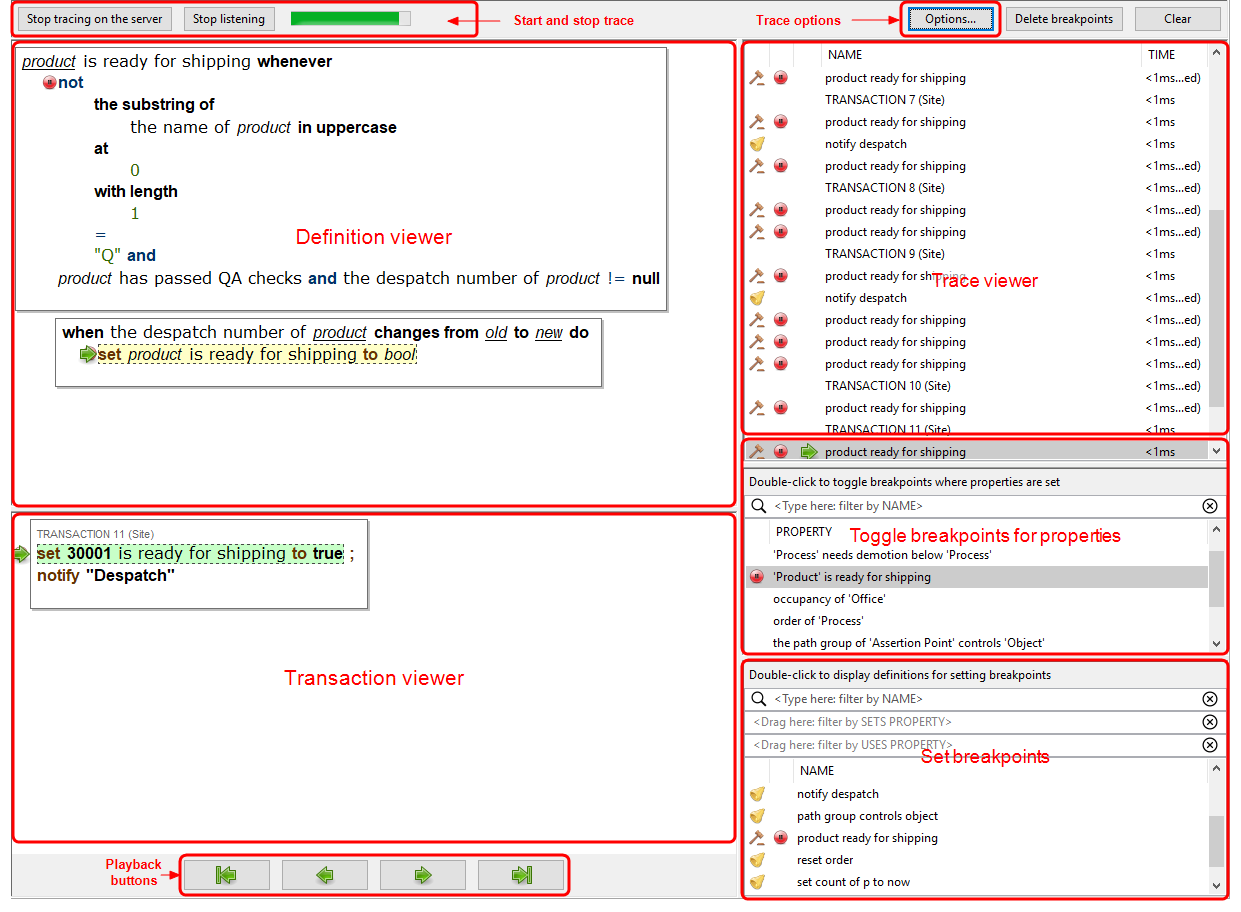
Displays the logic of the current rule definition. As you step through the trace, additional information is displayed explaining changes to be made.
You can click in the definition to set or unset a breakpoint.
Check Show variable values in the Options popup to display values of variables instead of variable names in the rule definition.
Displays the current transaction and lists the actual events and any actions performed on the data. Events are highlighted in green if the command executed successfully or red if the command failed to execute. Right-click a command to set or unset a breakpoint. Double-click a command to jump to its position in the Definition viewer and Trace viewer.
Lists transactions and the rules and events involved in each. The estimated elapsed time taken to process a transaction is shown.
- An icon to the left of a definition’s name identifies the kind of definition it is:

- Definitions with breakpoints that will actually be hit in this trace are identified by an icon that also indicates whether it is enabled:

- An arrow
 indicates progress when stepping through the trace and identifies the current definition.
 - Check Show skipped events in the Options popup to display events that have not been hit by the trace.
If the Real-time rules engine has been licensed and you have loaded a geometry cell in the Types and objects workspace, you can see cellular rule evaluations and the cell is indicated beside the transaction. Site-level transactions are labeled Site.
Other additional information includes: skipped for rule evaluations that didn't result in any changes, and event handlers for 'X becomes true' when X became false (and vice versa); recursive for an event that was handled within the previous evaluation.
You can copy the contents of the trace viewer to the Clipboard by clicking in it and pressing Ctrl+C. To clear the content of the trace viewer, click Clear.
Displays a list of properties set by the published rule and event definitions. By selecting a property, breakpoints are set wherever that property is set.
- Enter text at <Type here: filter by NAME> (case sensitive) to limit the definitions listed to those whose names match the your input. Click
 to remove the filter.
-
Double-click a property to toggle breakpoints. See Using Breakpoints.
Properties with breakpoints are identified by an icon indicating whether breakpoints are enabled or not:

Displays a list of all published rule and event definitions.
- Enter text at <Type here: filter by NAME> (case sensitive) to limit the definitions listed to those whose names match the your input. Click
 to remove the filter.
 - Drag properties into <Drag here: filter by SETS PROPERTY> or <Drag here: filter by USES PROPERTY> to display only definitions that set or use those properties.
- An icon to the left of a definition’s name identifies the kind of definition it is:

-
Double-click a definition to display it to set breakpoints. See Using Breakpoints.
Definitions with breakpoints are identified by an icon indicating whether breakpoints are enabled or not:

Use the playback buttons to step through the code. An arrow  indicates progress in each of the viewers.
 searches back through the trace for breakpoints
 steps back through the trace
 steps through the trace
 searches through the trace for breakpoints
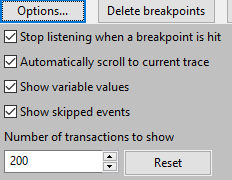
Click Options to display a popup of options to configure the trace:

- Choose Stop listening when a breakpoint is hit to stop the addition of events to the trace when a breakpoint is hit
- Choose Automatically scroll to current trace to keep the display in the Trace viewer in sync whilst stepping through definitions
- Choose Show variable values to display values instead of variable names in the Definition viewer
- Choose Show skipped events for the trace to include rule evaluations that didn't result in any changes, and event handlers for 'X becomes true' when X became false (and vice versa)
- By default, a maximum of 200 transactions is shown. You can enter a different value between 1 and 1000. Click Reset to return to the default setting