Managing Errors in SmartSpace Applications
Introduction and motivation
This document describes a set of generic definitions and best practice recommendations for SmartSpace error detection, handling, reporting, tracking and optimization.
In general, SmartSpace applications link together four different kinds of data:
- Data managed by external systems, accessed by SmartSpace integration services
- A logical model of the customer’s business process, encoded by SmartSpace rules
- Location data about the physical positions of objects in the world, derived from sensor systems
- Process data generated by end user behavior, as they perform various actions in the world
Because SmartSpace applications link together four different categories of information they can have four different kinds of error:
- Integration Error. Integration services suffer from software, hardware or network failure
- Logic Error. The model may be coded incorrectly, so application logic hits unexpected scenarios
- Sensing Error. Data from sensor systems will be subject to errors that exceed expected levels
- Process Error. End users may make mistakes that must be detected and communicated back
These different kinds of error are dealt with by different people in different places:
- Integration errors are dealt with by IT support people (generally off-site, non-customer staff)
- Logic errors are dealt with by product support people (always off-site, non-customer staff)
- Sensing errors are mostly dealt with by on-site maintenance people
- Process errors are mostly dealt with by on-site end users, depending on the process
The different job functions each have subtly different requirements for tool support:
- The standardized, site-and-application-independent, back end job functions in (1) and (2) can be supported very well using industry-standard health monitoring support
- The customer-targeted, application-and-location-dependent job functions in (4) are best supported by the SmartSpace application itself, possibly with very occasional use of health monitoring as a way of helping to optimize over time and to help to debug complex issues (e.g. sometimes a logic error may be falsely viewed as a process error and vice versa, so combining the data at the back end and in application test may be valuable)
- The job function in (3) lies somewhere in between these two extremes, in that general sensor system performance metrics are independent of the site and may be dealt with well by health monitoring, but individual errors are site-and-location-specific and are best dealt with using the kind of mechanisms found in SmartSpaceVisibility and Reporting
In SmartSpace we provide a single generic error model that supports all these kinds of error, can be extended and configured using the Rules engine developer tools, and supports the different job functions associated with them by integrating with the Health monitoring feature from Advanced IT support, as well as the Reporting and Visibility features.
Some specific error use cases
Examples of actual errors that might be raised
Here is a list of possible scenarios which might lead to assertion of an error condition:
- In a system using external devices, the device loses connection to SmartSpace. This would be an Integration Error associated with the individual device that had lost connection.
- In any RTLS system, an object has a tag with Warning or Error state. This is an instance of a Sensing Error associated with the object. It would not normally be communicated individually to an end user as an alert, but it would be useful to be able to view objects with the given error.
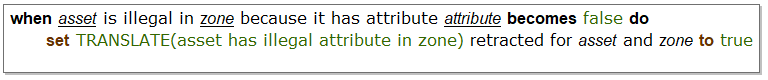
- In an asset tracking application, assets can be flagged as being an ‘illegal asset in zone’ for a given zone. This is a Process Error associated with the asset and the zone. It would likely be communicated to an end user in an alert, and it also has a location, which is the same as the location of the zone.
- In a ‘contact tracing’ application, we might want to log each encounter between users as a Process Error. This error would be associated with each person involved and would have a location, which would be the same as the location of one of the people but only for the time in which the error was actually occurring. The location of the error, and related information, would not normally be communicated to an end user but would be used in searches and reports.
- In some application, the error reporting model might itself be used in a way that violated some invariant. This would be a Logic Error associated with the actual error being raised at the time.
Examples of activities enabled by error reports
Here is a list of possible activities that we want to be able to support when errors occur and an outline of how we do this:
- Present individual error occurrences in an application-specific way to end users. We do this by using the existing alerting mechanisms (notify <Role>, notify <role> near <Object>, and notify <Role> near <Object> using <Search>)
- Drill down into application-specific details of individual error occurrences. To do this we need to have a way of associating extra user data with error occurrences
- Present a collated view showing all objects of a certain type that have any errors associated with them, probably also filtering by some set of errors. We would most likely want to do this by searching over some property that mentioned all the errors and objects concerned
- Report on the quantity and frequency of errors of various types over some period and detect trends and monitor performance against KPIs. This is most naturally done using the reports engine, and so requires integration of error support with reporting
- Drill down into underlying causes of errors, especially non-Process errors or Process errors that may have been incorrectly raised. This is most naturally done using the web-based dashboards available in health monitoring, and so requires integration of error support with the Health monitoring feature
- Support application development, deployment, upgrade and test, with all levels of errors, using the error framework to support standardized and controllable application test criteria
A summary classification of error types in SmartSpace Applications
This table summarizes our view of the various kinds of error that can occur in a SmartSpace application, and the appropriate processing for each of these kinds of error.
| Kind of error | Example error scenarios | Where they occur | What causes them | How they are detected | The users who should be told | How to tell them | Optimization mechanisms |
|---|---|---|---|---|---|---|---|
| Integration Error | Losing contact with remote devices or software systems | External systems | Network, hardware or coding errors | Integration components or application logic | IT support | Health dashboard with alerts | Historic health dashboards |
| Logic Error | Discovering logical objects to be in some unexpected state; preconditions or invariants violated | The application itself | Coding errors | Application logic | IT support | Health dashboard with alerts | Historic health dashboards |
| Sensing Error | Losing location events from tagged assets; RTLS errors leading to objects bouncing between zones | The sensing infrastructure | Sensor noise, environment problems | Location rules, or application logic | Physical maintenance staff (on site) | Health dashboard with alerts + map alerts | Historic health dashboards + map-based reporting |
| Process Error | End users violating process in ways that are expected and handled by the application | The end user execution of the business process | User errors | Application logic | End users, according to their role (on site) | Application-specific: map alert, search, email, HMI, … | SmartSpaceReporting + some historic dashboards |
Summary of intended error handling data flow

Overview of error handling features
Error handling data model and usage examples
A standard set of user-populated error enumeration types
There is an Error type, with four descendant types: Integration Error; Logic Error; Sensing Error and Process Error. The Error type itself descends from Enumeration, reflecting the intended use. New instances of Error represent different kinds of individual error, and not different error events.
A new kind of individual error is created by creating an instance of the appropriate Error type, so that each of the four error types lists out the possible errors that can occur, for example:
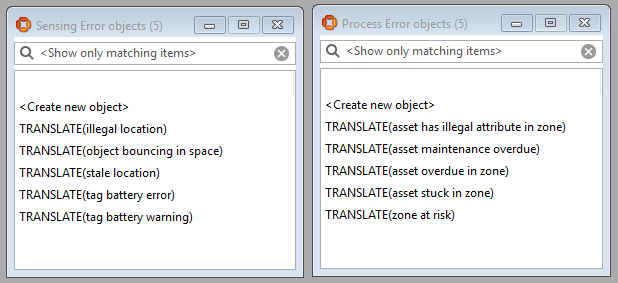
When creating a product module, it makes sense to use the TRANSLATE() feature so that the error descriptions can be localized.
Properties for recording error events and counts
All error events are recorded by asserting a single property:
Identical events are grouped by using the same sequence number, which is taken from the sequence number of the given individual error:
No ‘error event object instance’ by default
The error handling data model does not an object instance to denote an instance of an error event. This is because such an object instance is commonly not required for many of the use cases (e.g. arguably all use cases apart from the contact tracing case #4) and where some object instance is required it is for very application-specific reasons and has its own associated functionality (e.g. in case #4, some integration with driven objects, some timing information, …). Furthermore, creating an object generally requires creating a name to use the object effectively in searches, reports etc., and names must be unique so this is another thing that the user has to work to ensure; this using a new instance of an object means more work in business rules, often for no actual benefit.
If in some case it makes sense to create an instance of an object associated with the particular error then this can easily be achieved by creating a new object at the time the error is raised and associating it with the error event using the existing error event property as described above. The row in the error event property can then also potentially be used to control the object lifecycle.
Detail of the most general method for asserting error events
Some convenience methods are also provided to support error assertion, but it is permitted, if a bit verbose, to work directly with these properties to assert that an error event has occurred. And it helps to understand exactly what gets asserted when an error event is asserted, so we first deal with the complex and verbose way of asserting error events before looking later at the simple way.
For example, in an asset tracking application, when an asset is detected to be illegally placed in a zone, we could log an error event involving both the asset and the zone as follows; this creates two rows in the error reporting property:
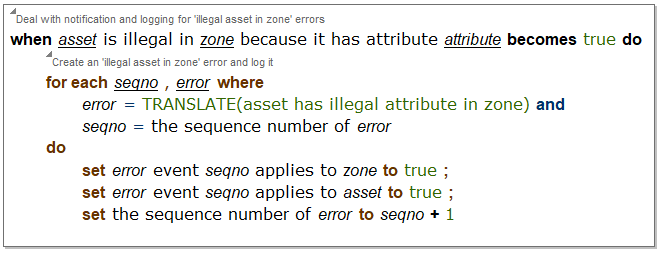
The value of ‘the sequence number of error’ also works as a true count of the number of events that have occurred for this error. The value of the sequence number in the assertion should always be the current value of the sequence number.
This method can be used to assert error events of arbitrary arity; that is, any number of objects may be associated with the (error, seqno) pair.
Automated clean-up for error events
It is important to ensure that the data model does not fill up with old error events, so two clean-up features are provided.
-
If a single row of the error event is deleted (for example, if the asset in the use case above is WIP which gets deleted after being shipped) then all the other rows are deleted as well.
-
If none of them is deleted by any other means, error event rows will persist until they are cleaned up according to an aging specification configured by the property:
the lifetime in hours of <Error> : DoubleThe lifetime is set to 24.0 hours when a new error instance is created, and it can be changed after that. If the lifetime is deleted, then that event of that error will persist forever, and a logic error will be raised. The error lifecycle is managed internally using a property:
the timestamp of <Error> event <Int> : Timewhich is set when the error event is asserted. Note that it is not appropriate to make this property into a parameter because Error is a user-defined type loaded in a module, and there is no easy support for parameters of user-defined types.
Errors are cleaned up automatically by the rules engine itself according to the policy “if the timestamp of error event id + the lifetime in hours of error < now then set the timestamp of error event id = null” (the two properties above are understood by the rules engine and this code is executed periodically inside the rules engine).
If a user has created properties whose row lifetime is determined by entries in the error event properties, then those user-created properties need to be cleaned up by adding extra event handlers to the error event properties.
Process-based clean-up for error events
The error events module is primarily concerned with recording that an error occurred, what it involved, and when it occurred, rather than with keeping track of the current error state. That is, there is no general support (and nor could there be) for canceling errors based on state.
Having said that, it is perfectly OK to cancel errors using event handlers. This is supported by some convenience properties, but as with error event assertion, it can be done directly. In any case it would generally be done using a ‘for each’ statement, of this general form, which cancels all instances of the error events that would be raised by the error state:
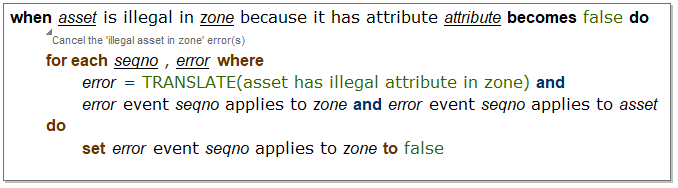
Note that only a single row needs to be deleted, as the automated deletion support will ensure that all the other error-related state is cleaned up.
Logic errors detected in use of the error events module
When an error object is created, its sequence number and lifetime values are initialized, and subsequent changes are restricted. The error reporting module itself detects and reports two different logic errors:
-
Any change to the sequence number, which is not just an increment by one (reported as an ‘illegal change to sequence number’ logic error),
-
Any deletion of the lifetime or setting the lifetime to a value less than zero (reported as an ‘illegal change to error lifetime’ logic error).
The event handlers ensure that the existence of an error event row implies the existence of a timestamp for that error event (and hence the eventual clean-up of the event row). There are no checks on the value of the sequence number used in an error event (but non-standard use will not lead to problems).
Simplified interface to error reporting and retracting
The general methods for asserting and retracting shown above will work for error events that involve an arbitrary number of errors, and will ensure that error assertion occurs within the same transaction as the event’s occurrence. But they have two limitations:
-
They are a bit verbose, and
-
They don’t work for cellular rules and event handlers (because the properties are at site level)
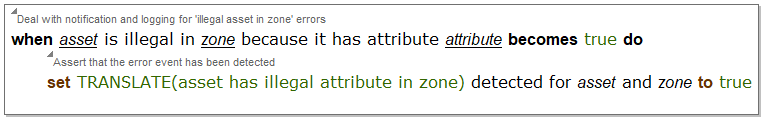
So, four convenience assertions are provided:
<Error> detected for <Object> : Bool
<Error> detected for <Object> and <Object> : Bool
<Error> retracted for <Object> : Bool
<Error> retracted for <Object> and <Object> : Bool
These properties are hosted by the assertion store, so they can be set directly from the cellular rules engine as well as the site-level rules engine. Event handlers for each of these assertions ensure that the error event is recorded in the same way as the earlier code snippets, and then they retract the relevant assertion.
These assertions only work for error events involving one or two objects, and they take the recording of the error event out of the transaction in which it occurred (because they use the asynchronous updating of the site-level rules engine from the assertion store), but they reduce the amount of code required to assert or retract an error event to the bare minimum. Using these techniques our earlier example can be rewritten as:
and the retraction of the same error event can be rewritten as:
Searches dealing with errors
The error reporting features described here are not intended to directly support searching in a convenient way. Typically, the errors that you want to be subject to search are process errors which are by their nature part of the application. If you want to create application features that communicate process error reports in a user-accessible way then you should normally use the existing features of Visibility (for example, in the use case above you should directly use the ‘<Asset> is illegal in <Zone> because it has attribute <Attribute>’ property).
It is also important to note that search-related functionality for process errors is generally concerned with error state, not error events. That is, in the world of search and visibility, we are primarily interested in fixing an existing error so that it goes away, and doing it in an application-specific way, whereas this module is mainly concerned with recording that an error occurred, what it involved, and when it occurred, although (as the section on process-based clean-up describes) we can easily incorporate error state into the model as well.
To provide tailored searches that deliver a generic view of error events to the user one useful technique is to maintain a derived view of the _ event _ applies to _ property, that is suitable for searching in the way that you would prefer. For example, if you want to search for all WIP with Process errors, then use business rules to update a specific view of the error events that deals with WIP process errors. However, remember that it is not normally advisable to create new unique error or exception objects in order to get round the fact that web searches are designed to return objects – a far better approach is to create an HMI-based UI that uses the queries available in Reporting which provide the extra flexibility required, as we can see below.
Reports dealing with errors
Generic error reporting also becomes valuable when considering the reports module, where it makes sense to consider all errors together as part of a general regime of process optimization. For example, if all process violations result in some process error, then standardized error reporting allows us to create a standard framework for reporting different kinds of error, and their changes in frequency over time.
It is easy to log multi-object errors by joining on the event sequence numbers. This example table shows all the zone/asset error events over a short period in an asset tracking application. This is generated by joining the _ event _ applies to _ relation (twice) with the zone, asset and error name properties:

and this kind of data can be further used to support charts, like this chart showing a breakdown of different asset/zone errors for a given day.

Visibility of error counts and events in health monitoring
One of the important benefits of a universal error reporting mechanism is that it makes it easier to do root cause analysis. For example, if a logic error is generated or a process error is found to have been raised incorrectly, this can be cross-referenced against other error streams (e.g. an object bouncing between spaces) and health data (e.g. sensor timing errors) to help identify the cause.
To support this kind of analysis, the error count and event data in the user data model are pushed to the health module as counts and event reports.
Error counts sent by the rules engine
Because the error reporting mechanism in the rules engine uses a sequence number which is constrained to monotonically increase, errors generated within SmartSpace user data all have a counter associated with them. This value is pushed periodically as a health report by the rules engine runtime using the metric:
smart_space_application_errors (counter)
with labels:
type = (process | sensing | logic | integration)
name = <the untranslated name of the error>
This supports graphing of event rates, deltas, and so on for all errors, with drill down through the four error types and their individual errors.
Error events sent by the rules engine
Every error event generated is also pushed to the health module, so that the event data can be searched and tabulated in the health tools. This is done using a gauge:
smart_space_application_error_event (gauge, value always = 1)
with labels:
type = (process | sensing | logic | integration)
name = <the untranslated name of the error>
object_id = <the id of the object>
object_type = <the type of the object>
object_name = <the name of the object>
event_index = <the sequence number of the event>
Metrics sent by other software
Some kinds of error, especially integration and sensing errors, might be detected by other software outside the rules engine (e.g. integration errors might be flagged in the RDBMS or EDC services, or sensing errors might be flagged in location rules). In these cases, the implementer should either:
-
Create a new error name and log error counts and events of the appropriate type directly to the health module, or
-
Put an error event assertion into the appropriate user data store, to cause an error event to be asserted, and then subsequently logged.
In general, if there is a good reason for getting the data into the user data store (e.g. if it would be valuable for user-visible reports or has some impact on business logic) then (2) would be used, otherwise (1) would be a better approach.
Example dashboard
This example shows a simple dashboard with two panels:
-
The bottom panel is counting process errors over time for an asset tracking application
-
The top panel is showing the individual process error events laid out on the timeline. The hover help shows the event occurring at a given time, with objects (in this case tool1 and Station 4) tied together by the event ID.
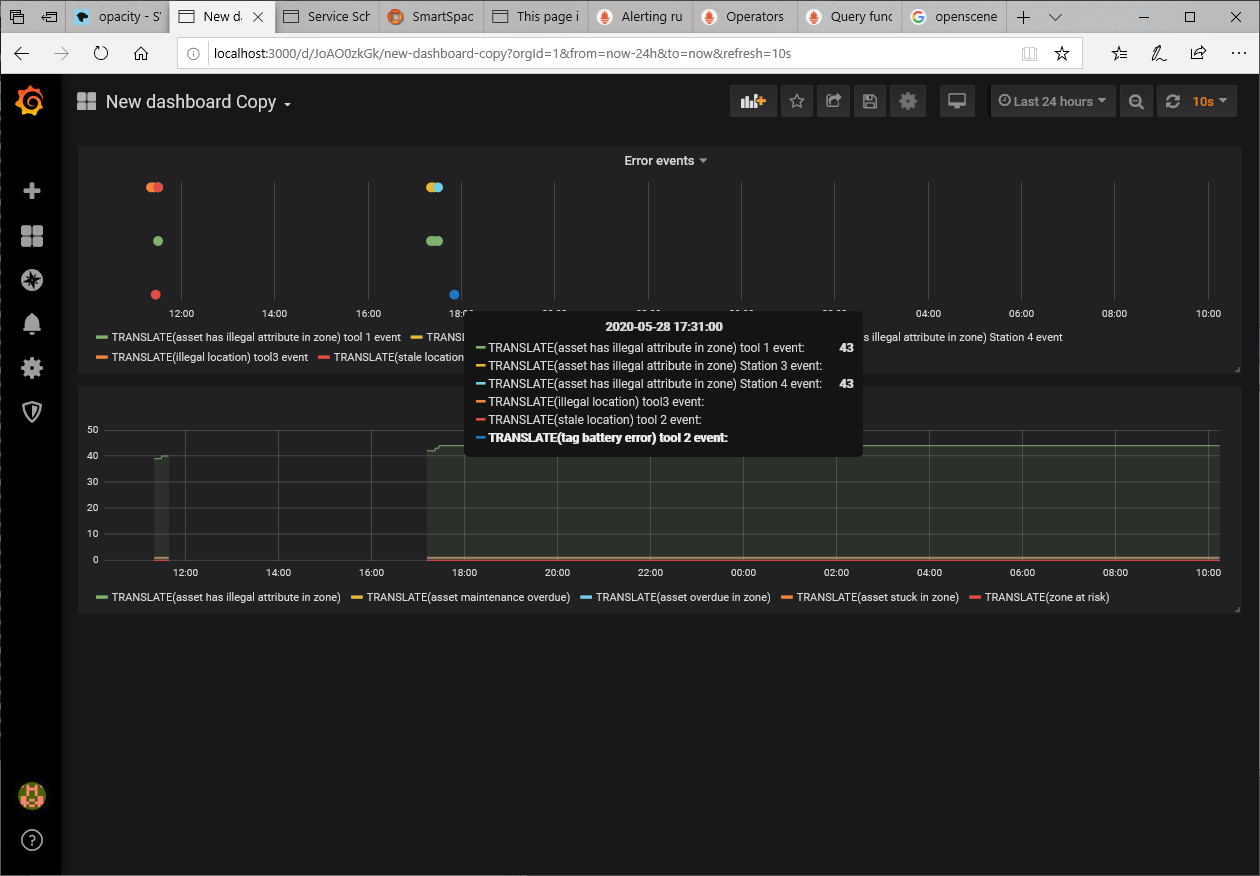
Note that, because Health monitoring / Prometheus is not really designed to be a reliable event recording mechanism, you will get a short sequence of event reports representing the error events, with the first event appearing quite soon after the error occurred (typically delayed by a time less than the period between scrapes used by Prometheus). The error counts are normally reported to the Ubisense health server every 5 minutes and are scraped by the Prometheus server shortly after that, so there may be a delay of up to a few minutes in the timeline between an error event report and the subsequent increase in the error count.
Installation and trivial usage example
Prerequisites
The installation instructions assume you have a dataset that includes working support for Business rules. The simple example also assumes that you have Visibility, Reporting, and Health monitoring, and that Prometheus and Grafana are running on your system.
Installing Error reporting
In BUSINESS RULES / Load, load the module file ubisense_error_reporting.ssc. You can download a copy of this file from the Ubisense Downloads Portal.
You should see these event handler definitions:

Publish the loaded rules so that they are now active in your dataset.
In the PROPERTY HISTORY screen set up the properties ‘the sequence number of <Error>’ and ‘<Error> event <Int> applies to <Object>’, ‘the name of <Enumeration>’ for temporal logging. You will of course need to ensure that your connection to a suitable database is working.
Configuring a simple example
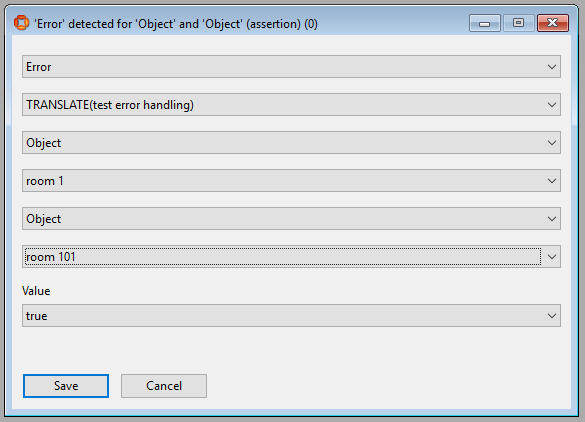
Create an example error object using translations. For example, the logic error “TRANSLATE(test error handling)”:
")
If you have created a translatable name then you may wish to register translations using ubisense_udm_admin (type register translations ; at the prompt).
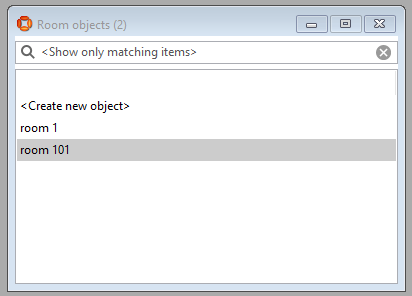
Create some objects to be able to demonstrate error reporting. For example, two room objects:
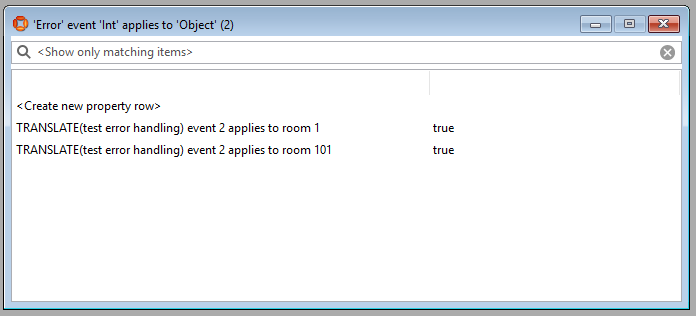
Log an error using ‘<Error> detected for <Object>’ or ‘<Error> detected for <Object> and <Object>’:
You will be able to see the resulting error event in the object browser (in this example we had already asserted two other errors previously):
In Reporting you should be able to create a query like this join to show the event(s) raised:

And finally, it is possible to create a Health monitoring dashboard that will show the error raised, with details of the two objects in the event, and shortly after show the error count increasing for the relevant error:
