Overview of Health monitoring
This document describes the features and suggested configuration of health monitoring in SmartSpace 3.3 and later, including DIMENSION4 sensor and tag health
Audience
This guide should be read by those who will be setting up or maintaining a SmartSpace system, and want to provide monitoring of the status and performance of the system over time.
Health Monitoring Architecture
The health monitoring architecture is designed to provide isolation between monitoring and operation of the SmartSpace platform, so that health monitoring has minimal impact on operational resources. It is also designed to be modular so that it composes with the particular product features that the customer has licensed, and to scale to large volumes of recorded data if that is required.
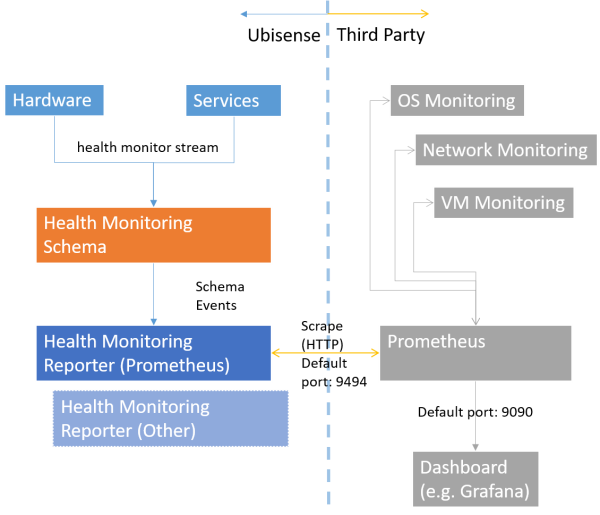
The architecture of health monitoring in SmartSpace
Internally, various components of the SmartSpace system deliver measurements periodically to a central health monitoring service (Ubisense/IT support/Health metrics server), where they are transiently recorded in a schema. The delivery protocol uses UDP to a configured address and port, and is low cost and unreliable – packets can be dropped if the network or server is highly loaded.
Separate services then expose the recorded measurements to be scraped periodically by an external metrics database system. In this release the only format supported is Prometheus. This is provided by the service Ubisense/IT support/Health metrics reporter.
Configuring Health Monitoring
Requirements
Health monitoring requires SmartSpace 3.3.6718 or later, and is also supported by DIMENSION4 1.4 or later (sensor software later than 2586).
SmartSpace
, DIMENSION4
and ACS Configuration
To configure health monitoring, first configure SmartSpace
health_mcast_addr
The address to which measurements are sent. This should either be a multicast address, or should be the unicast address or DNS name of the server on which the service “Ubisense/IT support/Health metrics server” is deployed. Default value: 239.255.255.252
The port to which measurements are sent. This must be available on the server on which service “Ubisense/IT support/Health metrics server” is deployed, and must not be blocked by a firewall. Set this to 0 to disable all sending of health measurements. Default value:
Note: In versions earlier than 3.7, the default value for health_mcast_port was 49976. The new default of 12019 is outside the recommended dynamic port range for Ubisense servers, preventing a possible failure of services to start. If health_mcast_port is not configured in your system, and you have DIMENSION4 sensors running D4 software earlier than 3.7, then you should explicitly configure health_mcast_port to 12019, and reboot the sensors after deploying this release, otherwise the sensors will not report their health metrics.
health_reporter_port
The port on which the health metrics are exposed for scraping by Prometheus. The service “Ubisense/IT support/Health metrics reporter” listens on this port for HTTP get requests from Prometheus, and responds with the current values of all metrics. Default value: 9494
As originally delivered, the health monitoring reporter service would bind to either localhost (in standalone mode) or all external ip addresses (in non-standalone mode). Now by default, it binds to any interface. To bind to a specific interface, set the "health_reporter_interface" to the ip address of the interface you require.
Buffering for the health metric server
The following configuration parameters define the buffering for the health metric server. These parameters are available from SmartSpace version 3.10.
| Configuration parameter | Default value |
|---|---|
|
health_server_recoverable_loss |
500, in UDP Packets |
|
health_server_invoke_buffer |
1000000, in bytes |
|
health_server_srm_buffer |
1000000, in bytes |
These default values work for systems where the health metric update rates burst at up to 1000-2000 per second. If a platform has even higher rates, such that repeated dumps of the UHealth%Data schema are seen, these values could be increased.
Installation
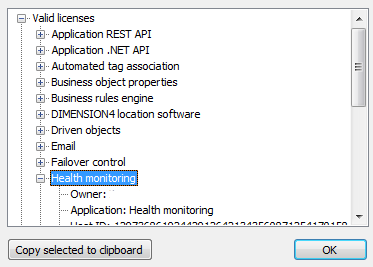
The IT support component must be licensed for release 3.3 or later. To ensure this is enabled, check Platform Control/Licenses, and open Valid licenses. You should see Health monitoring as one of the valid licenses.
Now use Service Manager/INSTALL SERVICE, and open the SmartSpace distribution packages folder. Select the Health monitoring feature, and click Install.
For DIMENSION4 sensor support, upgrade to a version of the Dimension 4 software that supports health monitoring, and reboot sensors so they are running the correct software version.
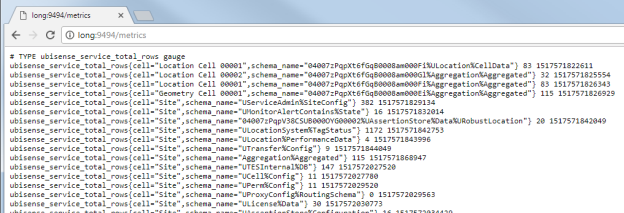
Verify that monitoring is working by visiting http://<server>:9494/metrics in a browser, where server is the host on which the “Ubisense/IT support/Health monitoring reporter service” is deployed. You should see a text response containing some metric values.
Configuring Third Party Software
The third party software can be run on a separate server from the rest of the Ubisense SmartSpace system, to provide maximum isolation. Prometheus, while normally very efficient, can use a significant amount of memory and disk IO, when large queries are run and on startup, so it is not recommended for a production system to use the same server.
Prometheus
Prometheus is a widely used open source monitoring solution available under the Apache 2 license. There is extensive documentation on installing and configuring Prometheus on the web site https://prometheus.io/ from which the software can be downloaded for free. In this guide we will describe a simple installation of Prometheus, but for production use we recommend consulting the documentation especially the section on Storage configuration. Prometheus uses disk storage by default, and this may be suitable for production use depending on requirements, but it can also be configured to use remote storage integrations.
The simple Prometheus configuration file, ubisense.yml, looks like this:
# global configuration
global:
  # Set the scrape interval to every 15 seconds.
  scrape_interval:     15s
  # Evaluate rules every 15 seconds.
  evaluation_interval: 15s
  # scrape_timeout is set to the global default (10s).

# A scrape configuration for Ubisense SmartSpace, with the health
# monitor reporting service running on "ubicore1".
scrape_configs:
  - job_name: 'ubisense'
    static_configs:
      - targets: ['ubicore1:9494']
To run Prometheus, execute:
prometheus.exe --config.file=ubisense.yml
Now check that Prometheus is available on its default port by browsing to http://localhost:9090/
Note that Prometheus can be used to capture other data such as server CPU/Memory and disk, and these can be incorporated into the monitoring dashboards. See the online help for details.
Grafana
Grafana is a widely used time series analytics and dashboard building front-end for Prometheus. It is also open source and is available from https://grafana.com/ under the Apache 2 license. For production configuration, see the installation documentation. This guide is a simple configuration for getting started.
Download and run Grafana – all configuration can be done inside the web site, which by default is on http://localhost:3000/. Login in as admin:admin (the defaults – these can be changed by using a config file).
Connect to Prometheus
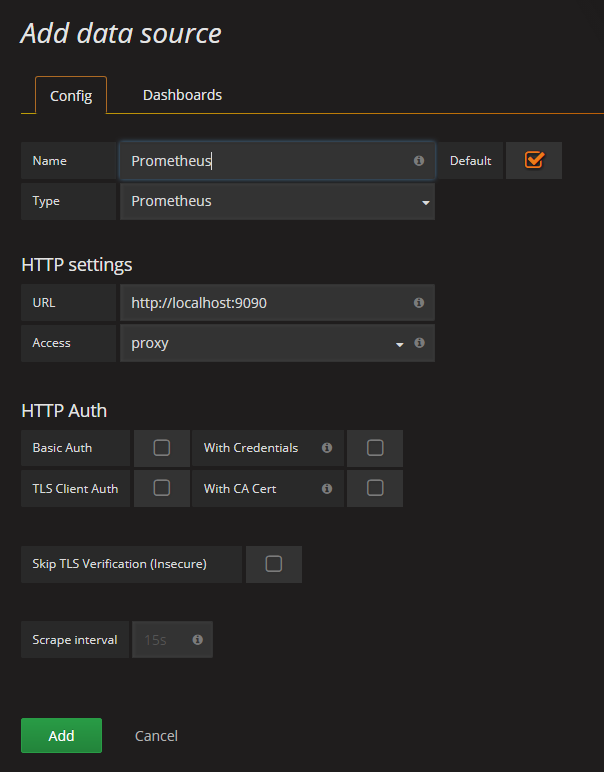
Add Prometheus as a data source. Select “create your first datasource” from the home page. Call the datasource “Prometheus” (careful to spell this correctly, as it is referenced with this name in the sample dashboards), with Type “Prometheus”. Under HTTP settings, set the URL to http://localhost:9090, and set Access to “proxy”. Click Add.
Load Sample Dashboards
Sample dashboard configurations are available in the Application Manager. Go to the DOWNLOADABLES task and select
IT support/Health metrics sample dashboards. In the Grafana web site, select Dashboards/Import
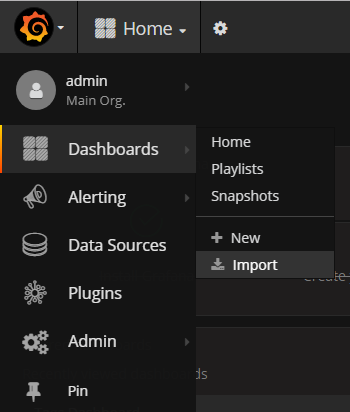
Now select Upload .json file. Navigate to one of the .json files, and upload it. You should see a working dashboard.
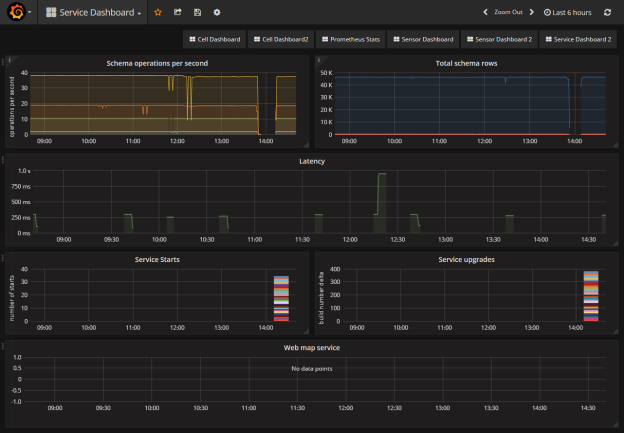
Metrics and Sample Dashboards
The following are available on the Ubisense Downloads Portal:
- Zipfiles of sample Grafana dashboards on the Dashboards page for
- SmartSpace and DIMENSION4
- ACS
- Location quality monitoring
- A spreadsheet giving details of the metrics provided (these can be browsed using the standard Grafana interface)