Web reports

Deliver reports based on location and property history
Summary
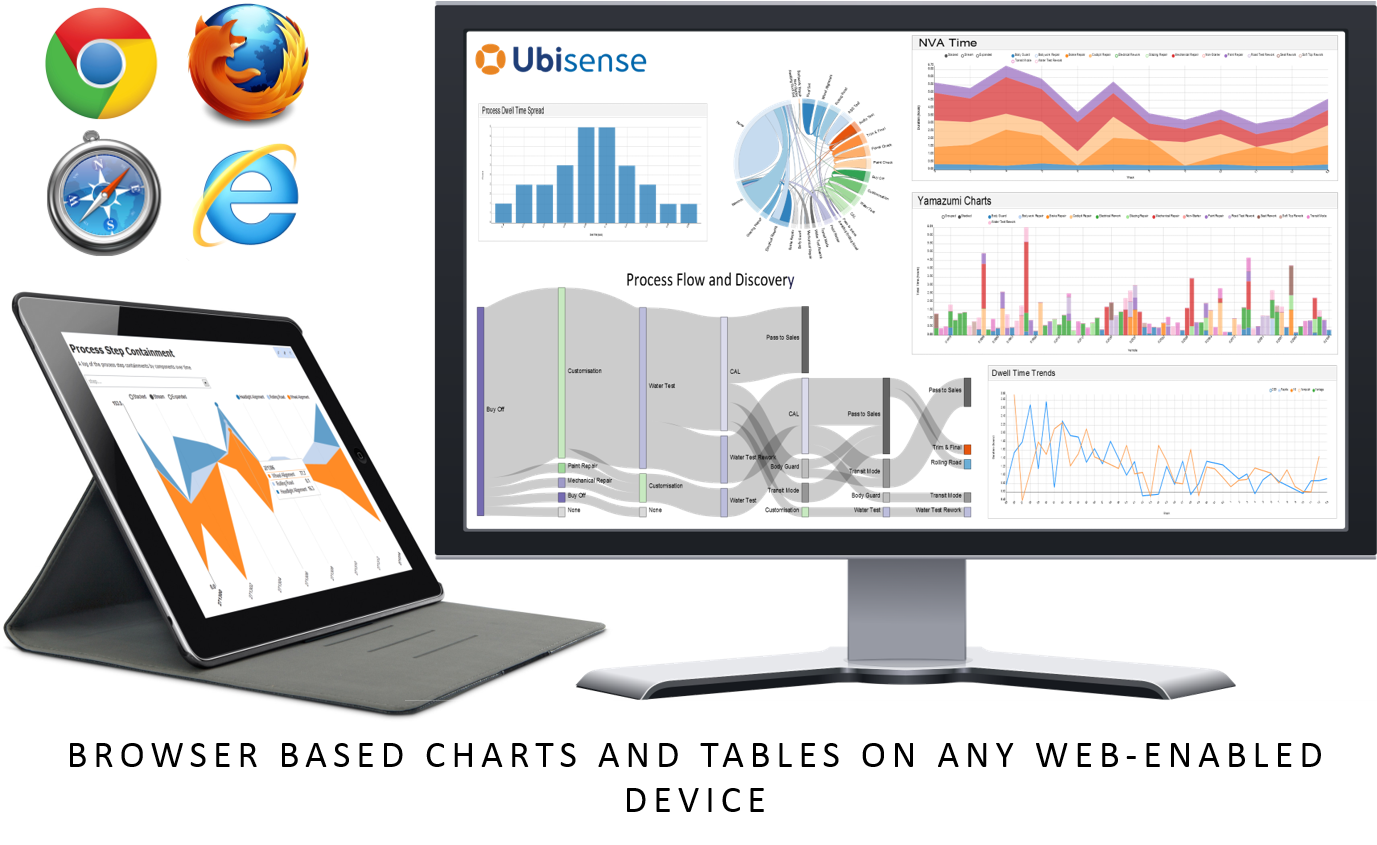
The Web reports feature runs queries over the recorded location and property history to generate sophisticated tabular and chart-based reports displayed in the browser. On its own, this feature can deliver pre-built reports, such as those available as part of a vertical application. With the Reports engine developer feature, reports can be edited on line.
Web reports can be accessed from a wide variety of devices, ranging from desktop computers to tablets and phones, and do not require installation.
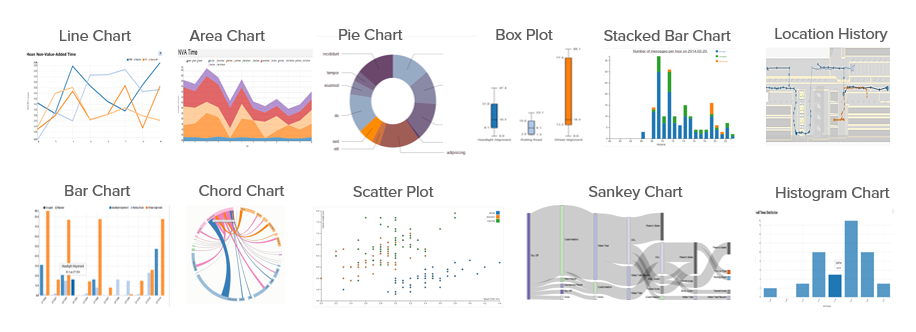
Supported charts include line, discrete bar, multi-bar, horizontal bar, stacked area, scatter, cumulative line, line and focus, pie, histogram, box plot, Sankey diagram, chord diagram and location history.
