Web reports
Deliver reports based on location and property history
Summary
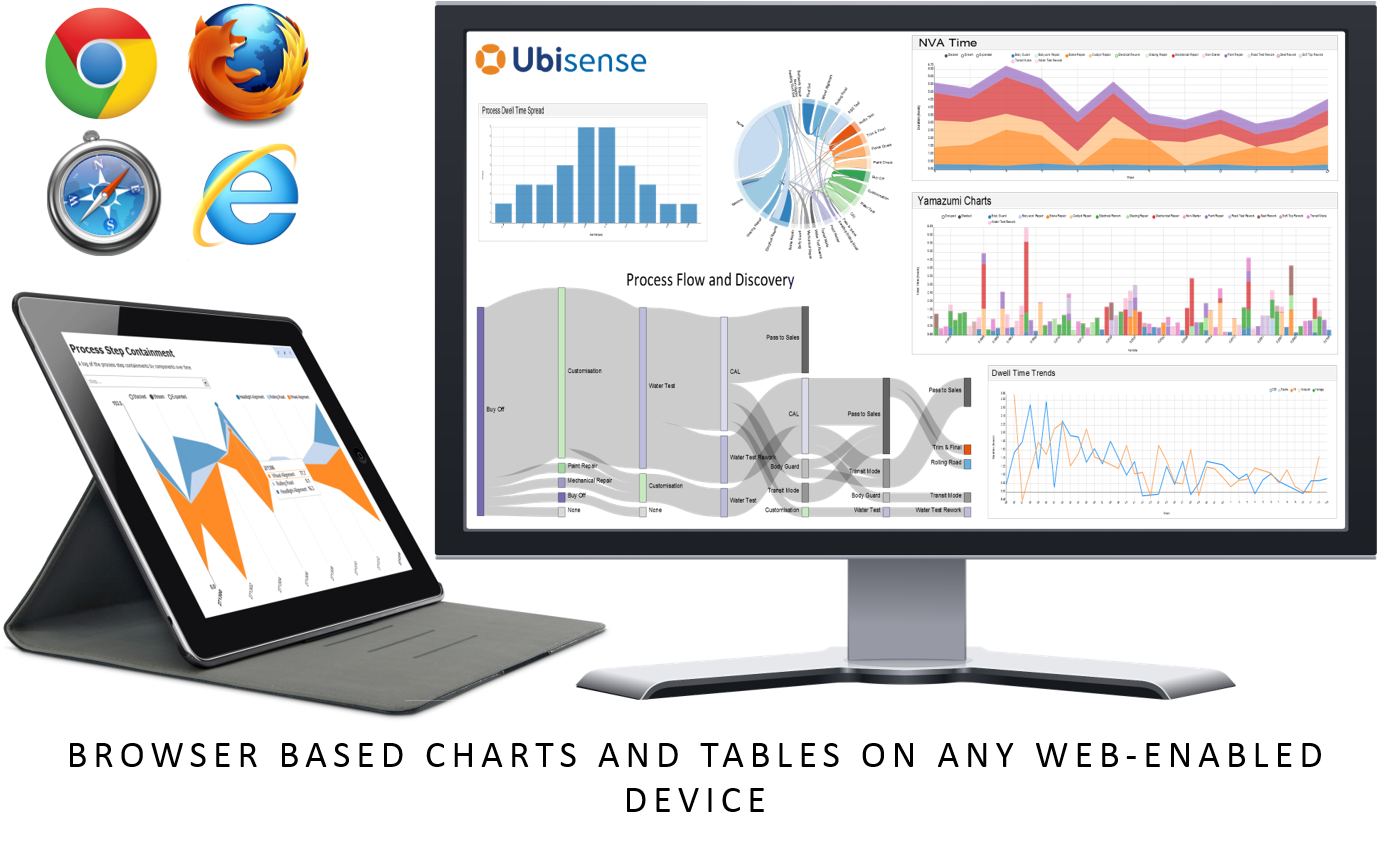
The Web reports feature runs queries over the recorded location and property history to generate sophisticated tabular and chart-based reports displayed in the browser. On its own, this feature can deliver pre-built reports, such as those available as part of a vertical application. With the Reports engine developer feature, reports can be edited on line.
Web reports can be accessed from a wide variety of devices, ranging from desktop computers to tablets and phones, and do not require installation.
Supported charts include line, discrete bar, multi-bar, horizontal bar, stacked area, scatter, cumulative line, line and focus, pie, histogram, box plot, Sankey diagram, chord diagram and location history.

Web reports at runtime
SmartSpace reports are browser-based tabular and chart-based reports based on queries run on the location and property history (see Reports engine developer for information on loading preconfigured reports and using Reports engine developer to create your own reports).
To view configured reports, go to the web site, and click on the Reports link on the top menu bar. If this link is not shown, you are not logged in as a user with access to any reports. Make sure you click Login.
The set of reports available to your user roles will be displayed.
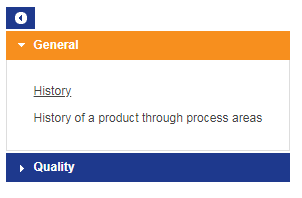
The reports are grouped by the role for which they are intended. To view reports in a role, click the title of the role.
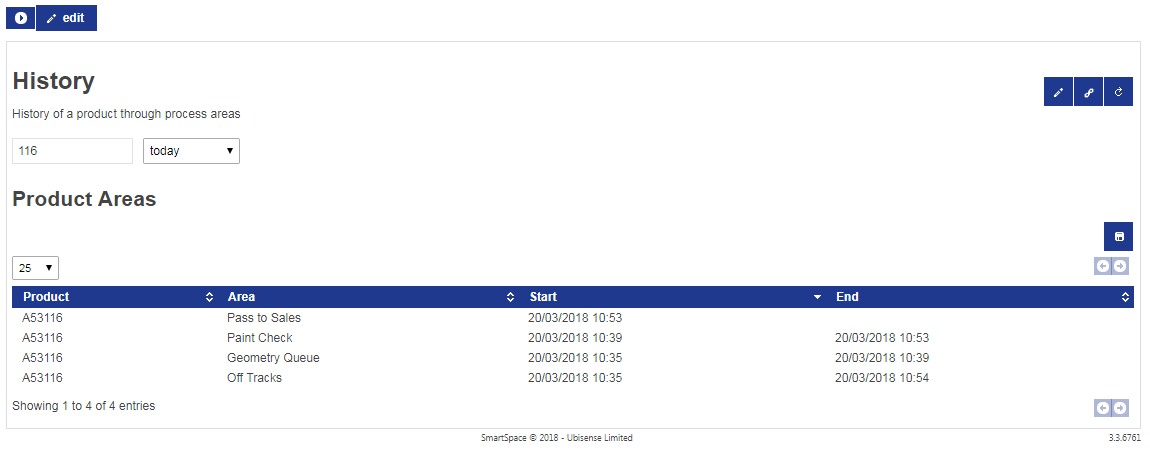
To view a report, click the report link. Controls at the top of each report can be used to restrict the set of results returned.
Buttons
The following buttons are on the top left:
 Click this to show the list of reports available to you.
 Click this to edit all reports. You must be an administrator to see this button.
 Click this dropdown to select the page size to display in a table.
The following buttons are on the right:
 This navigates to a link directly to the current report with the current parameters as entered.
 This refreshes the data in the report.
 This saves the current output of the report division as a file – a text CSV file for a table division, or an SVG image for a chart.
 These buttons are used to navigate through multiple pages of results.
 If shown this allows you to edit the report definition. You must be an administrator to see this button.
Table Sorting
You can click the header lines in a table to sort the table by that column. Click again to reverse the order of sorting. Hold down the Shift key and click to add another column as a secondary sort order.


