Reviewing Location Events
You can check the location of tags by reviewing either:
-
Historical events, which show the location history of one or more tags.
-
Real-time events, which show the current location of one or more tags.
When data is retrieved using filters, the filtering is done on the server side, so that it is possible to pull back complex queries without putting lots of data on the network. In general it is incorrect to try to work out how well a system is performing by looking at the events files. It is a much better approach to use the offline scriptable analysis tools described in Filter Configuration.
Getting Location Events
Listening in Real Time
When you listen in real time, you can review the events as and when they are generated by the sensors.
To view the location of tags in real time:
-
On the Review location events tab, clear the display if required.
-
Click Get events.
Notice the maximum number of real-time events to display. We recommend that you do not normally change this.
- Select the Listen in real time option.
- Select the Location Cell.
-
Click Start listening.
- Monitor events as they occur. See Reviewing Location Events.
- When you have finished, click Stop listening.
-
You can now:
- Save the events by exporting them to an event file. See Exporting Location Events.
- Filter the events to show just a subset of the events. See Filtering Messages.
Retrieving Historical Location Events
To view historical location events:
-
On the Review location events tab, if necessary click Clear.
- Click Get events.
- Enter the maximum number of events to retrieve.
-
Select the Use last or Enter timespan options.
- Select the Location Cell.
-
Click Retrieve Messages.
After all the location events within the timespan are retrieved, the button changes back to Get events.
-
Review the events that have been retrieved.
- You can now:
- Retrieve events for other Location Cells, and LSC will merge them into the timeline, in chronological order.
- Load events by importing them from an event file.
- Filter the events to show just a subset of the events.
- Export the events in the timeline.
Filtering Messages
To filter location events that you have retrieved whether real-time or historical:
- Click Get events.
- In the Times section, select Filter messages that have already been retrieved.
-
In the Filters section, enter a Tag ID
You can also paste in a previously-copied tag ID by clicking in the Tag id(s) input box and pressing CTRL+V.
You can also set up advanced filter controls if necessary. To do this, click Switch to advanced filter controls and then follow the onscreen instructions.
- Click Filter Messages.
You can now review the filtered messages.
Troubleshooting
If no event data is displayed, check that the machine on which LSC is running is listening on the correct port or network interface card (NIC)—the correct NIC is the one that connects via the network to the Location Platform server. If the incorrect NIC is being used, the top line on Events page shows that the IP address is 0.0.0.0: <port>.
To obtain the IP address of the NIC that LSC is currently using: on the Review location events tab, start listening in real time. The IP address is shown in the top left of the tab.
If necessary, you can set the correct IP address of the NIC in the Windows registry:
- In the Windows Registry Editor, go to Computer > HKEY_LOCAL_MACHINE> SOFTWARE > Wow6432Node > Ubisense 2.1 > Platform > Config.
- Add a new registry entry (String Value) called platform_interface.
- Set the value of the entry to the IP address (for example, 10.42.55.66) of the NIC connected to the Location Platform server.
- Restart the Location Platform services.
- Restart the LSC.
Reviewing Location Events
Events are generated by sensors if logging is enabled, the sensors are configured correctly, and you have a placed a tag that can be seen by the sensors.
To review location events, scroll through the timeline
- Press the Left or Right Arrow keys to move the timeline by 1
- Press PgUp or PgDn to move the timeline by 10
- Press Home to move the timeline to the start
- Press End to move the timeline to the end
- Press Up arrow or Down arrow to move the timeline to the next or previous event for the current tag
- Hold Ctrl in combination with other keys to move the timeline to valid events only
- Hold Ctrl+Shift in combination with other keys to move the timeline to invalid events only
- Jump to a specific event by typing a valid event number
- Type a string S, where S contains characters from the set [0123456789abcdef], to move the timeline to that event number if it is valid, or to the first event found with a tag whose ID, excluding colons, contains S.
Viewing an individual tag trajectory
Several features are available to help you focus on a particular tag trail you are interested in.
-
To display events relating to a specific tag, you can copy a tag number from the timeline by pressing Ctrl+C, clicking Get events and then pasting the tag ID into the simple filter.
-
To select an event near to a particular point on the map, hold down Alt and then double-click on the location you are interested in.
-
To pan the map to the current event in the timeline, press the spacebar (the timeline must have the focus for this to work).
-
If the tag trail you are trying to view is hard to see against the background, you can use the bracket keys '[' and ']' to cycle through different colors to improve the tag trail's visibility (the map or timeline must have the focus for this to work).
Example of OK Orientation and Timing Results
A sensor will generate events by using the measurements shown in the following screen shot.
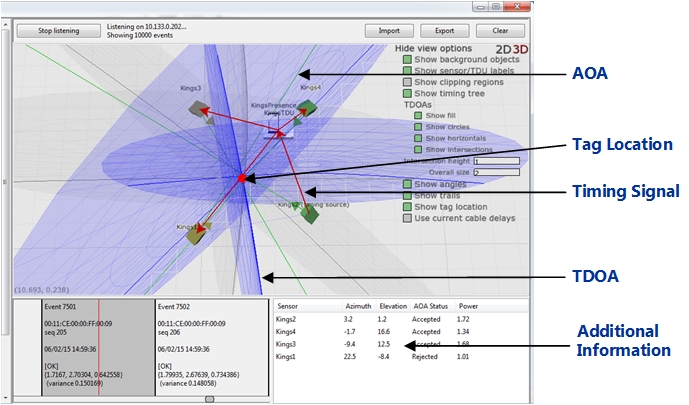
Events Generated by Sensors with OK Solver Results
For these sensors:
-
The TDOAs are blue and the TDOAs intersect at the tag location.
-
The AOAs are green.
If you have chosen to review events for multiple tags, the red dot on the screen moves from one location to the other, indicating the individual location of each tag.
Additional information on how a location event was calculated is shown in the bottom right pane. Click a sensor to see all the pairs involving this sensor, and the measurements. The map will be updated to show only the TDOAs for the selected sensor.
Example with an Omni Sensor and OK Results
A combination of directional sensors and an omni sensor are shown in the following example.
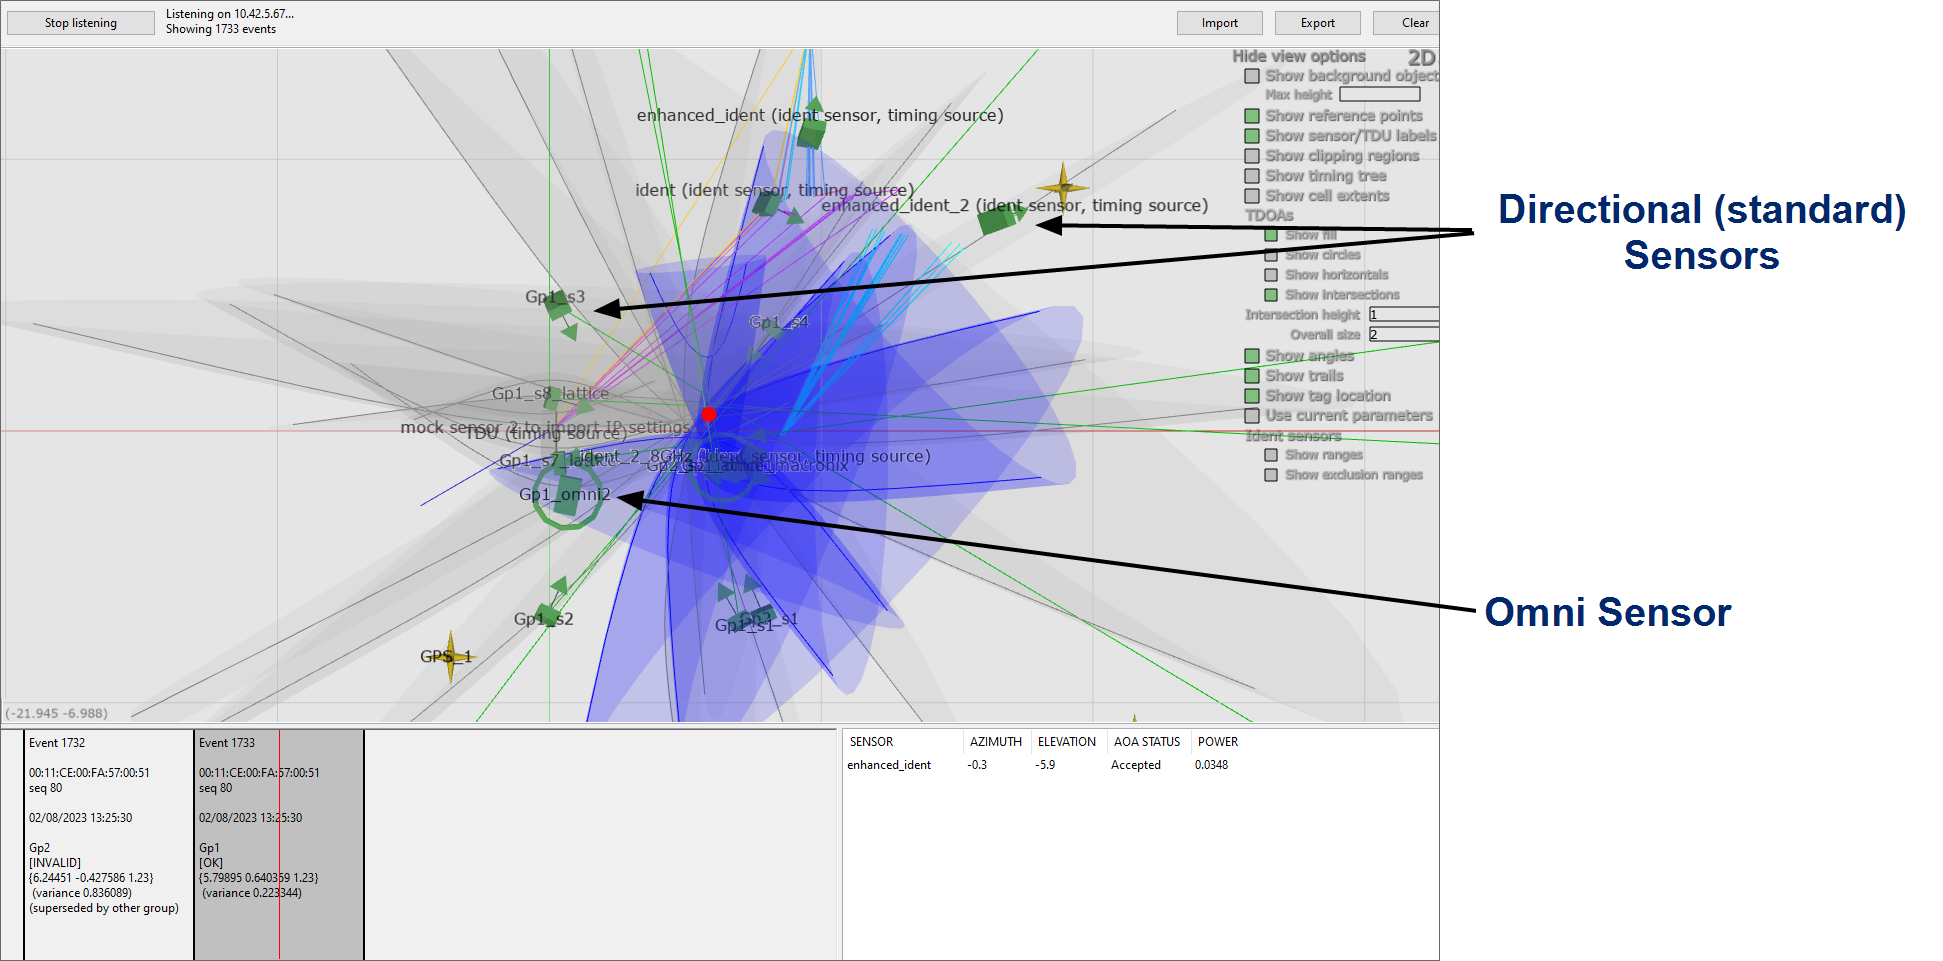
Events Generated by Sensors and Omni Sensors with OK Solver Results
Omni Sensors are displayed differently to directional sensors. When an omni sensor first registers with the D4 configuration service, it updates a 'receiver type' property in the configuration data store which causes the software to use a different representation: you do not need to set this representation yourself.
Poor Orientation and Timing Results
A sensor with results that are poor, or not done, can still sight tags and generate events based on the estimated sensor orientations that you might have provided. However, some of the TDOAs are rejected.
Events of this type are shown in the following screen shot.
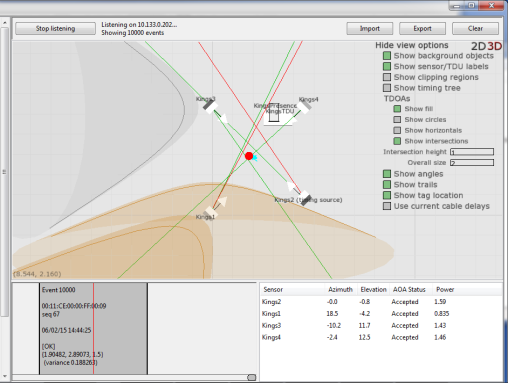
Events Generated by Sensors with Poor Solver Results
In this situation:
-
The TDOAs are in amber.
-
Some of the AOAs are red, which indicate that they are being rejected.
This may also mean that the event is the result of a reflection rather than a problem with the Solver run.
Group Arbitration Failures
Pairs of events are colored red when all of the following conditions apply:
-
Tags are identical
-
Sequence numbers are identical
-
Locations are both marked OK
-
Timestamps are within 1 second of each other
This is because more than one sensor group is generating a valid location for a single tag event, which is an error. The correct behavior would be that the sensors communicate and determine one location event to be valid, and any others to be "superseded by other group".
In addition to the red highlight on events in the timeline, you can:
- Identify the group that generated a measurement by finding the group name in the event
- See the group’s clipping region, if you have some clipping regions defined and have checked Show clipping regions in the view options
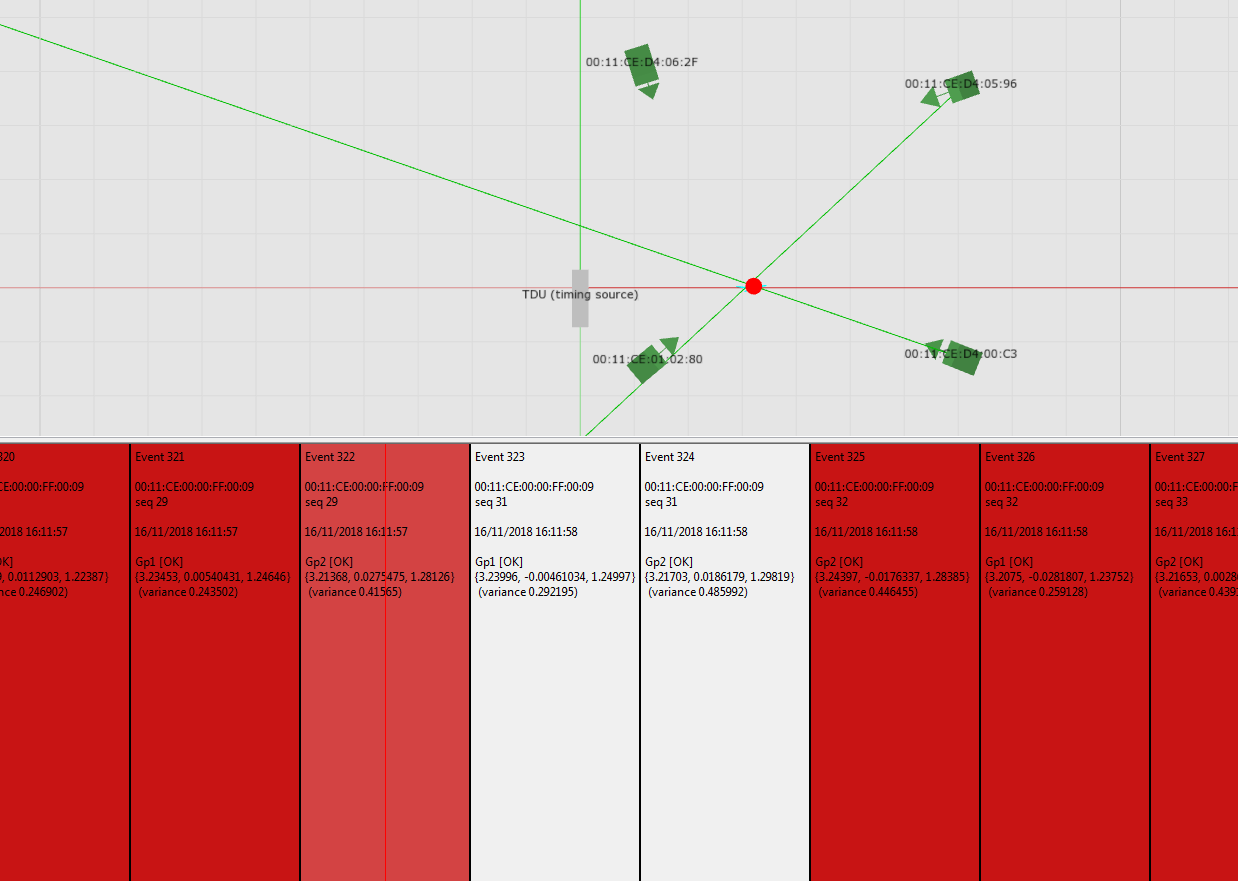
Events Highlighted due to Arbitration Failure
Importing Location Events
You can import location events from saved event files, for diagnostic purposes.
You can load events from multiple cells. The events are then sorted by time received and you can use this information to 'follow' a tag through the site.
To import location events:
-
On the Review location events tab, click Import.
-
Open the required location events file (.ubievents file).
Do not increase the number of events to import above the displayed maximum. Your PC may run out of memory if you do so.
-
Click Import.
The location events from the events file are displayed on the screen.
Exporting Location Events
You can export location events to store the location history of a tag for diagnostic purposes.
To export location events:
-
On the Review location events tab, click Get events.
-
Retrieve the required location events, as described in Getting Location Events.
-
Click Export, and then save the location events as a .ubievents file.